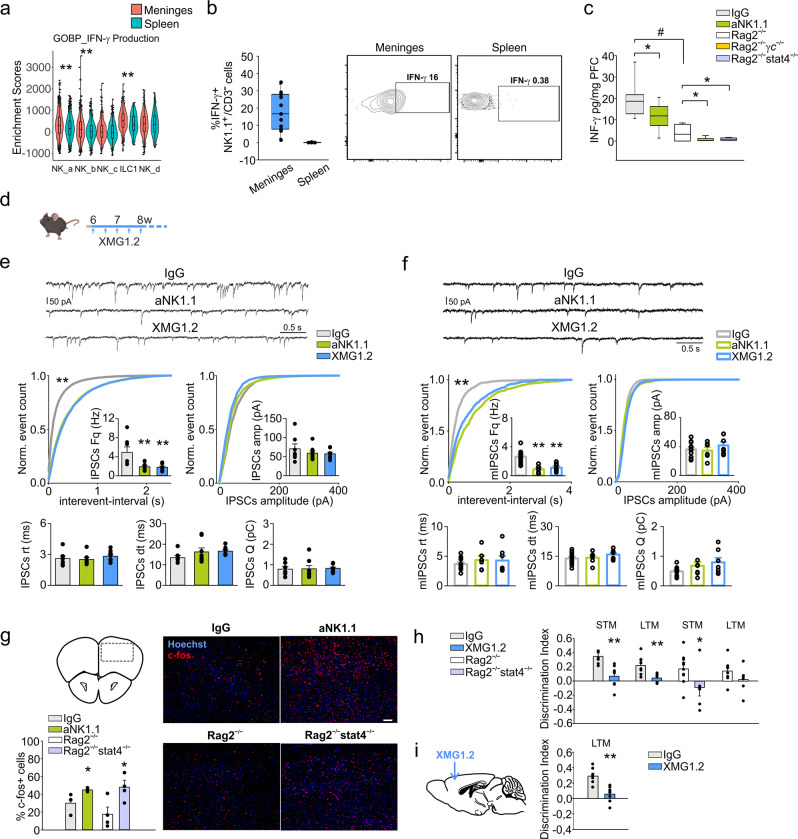
Fig. 3. ILC1-NKcells derived-IFN-γ regulates non spatial memory.
a Violin plot of the distribution of genes related to IFN-γ production in different clusters and tissue (n = 50 mice **p < 0.01 Kruskal–Wallis post-hoc Dunn test). b FACS analysis of frequency of IFN-γ+ cells in the CD3−/NK1.1+ cell population obtained from the meninges and spleen (n = 11). Right: representative plot of meningeal and splenic frequency of CD3−/NK1.1+ cells. c Level of IFN-γ protein in the PFC of mice treated with IgG or aNK1.1 (n = 9 mice per condition, *p = 0.033 two-tailed Student’s t test), and Rag2−/−, Rag2−/−γc−/− and Rag2−/−stat4−/− mice (n = 7 mice per group, *p = 0.013 two-tailed Student’s t test; IgG-treated mice vs Rag2−/− #p < 0.001 two-tailed Student’s t test). For boxplots (a–c) the center line, boxes and whiskers represent the median, inner quartiles, and rest of the data distribution, respectively. d Scheme of XMG1.2 treatment in C57BL/6 mice. e Top: Representative traces of sIPSCs recorded in PFC L5 pyramidal neurons obtained from mice chronically treated with IgG, aNK1.1, or XMG1.2. Bottom: Cumulative distribution and bar graph (inset) of interevent-interval, amplitude values, rise time (rt), decay time (dt) and mean charge (Q) mean values of sIPSCs obtained from 7, 8, and 8 cells recorded from mice treated with IgG, aNK1.1, and XMG1.2, respectively (one-way ANOVA **p < 0.001, Ks = 0.95). The inset bar graph represents the mean frequency values recorded in the same cells (one-way ANOVA **p = 0.005). Data are expressed as mean ± SEM. f Top: Representative traces of mIPSCs recorded in L5 pyramidal neurons obtained from mice chronically treated with IgG, aNK1.1, or XMG1.2. Bottom: Cumulative distribution of interevent-interval, amplitude values, rise time (rt), decay time (dt) and mean charge (Q) mean values of mIPSCs obtained from 11, 7, and 6 cells recorded from mice treated with IgG, aNK1.1, and XMG1.2, respectively (**p < 0.001, Ks = 0.68). The inset bar graph represents the mean frequency values recorded in the same cells (*p < 0.001). Data are expressed as mean ± SEM. g Analysis of c-fos+ cells in the PFC of mice treated with IgG or aNK1.1 and Rag2−/− or Rag2−/−stat4−/− mice expressed as % of total nuclei (n = 4 mice per group, *p < 0.034 two-tailed Student’s t test). Representative immunofluorescences on the right. Error bars show mean ± SEM. Scale bar: 100 μm. h Discrimination index in NOR test analyzed after 1 h (STM) and 24 h (LTM) in mice treated with IgG and XMG1.2 (n = 8 mice per condition; **p < 0.001 one-way ANOVA), and Rag2−/− (n = 11) and Rag2−/−stat4−/− (n = 7) mice (*p = 0.034 one-way ANOVA). Data are expressed as mean ± SEM. i Left: Scheme of XMG1.2 intracerebral administration in C57BL/6 mice. Right: Discrimination index in NOR test analyzed in mice with intra-hippocampal administration of IgG or XMG1.2 (n = 7 mice per condition; **p < 0.004 one-way ANOVA). Data are expressed as mean ± SEM. (d, g, i) Figure created with BioRender.com.

