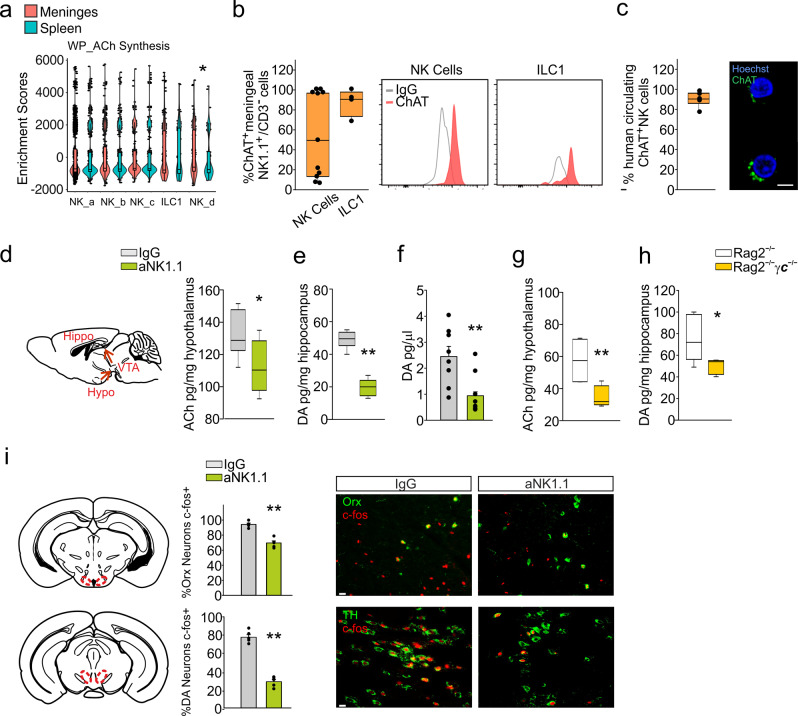
Fig. 4. ILC1-NKcells derived-Ach regulates anxiety like behavior.
a Violin plot of the distribution of genes related to ACh synthesis in different clusters and tissue (n = 50 mice *p < 0.05 Kruskal–Wallis post-hoc Dunn test). b FACS analysis of the frequency of ChAT+ cells in the CD3−/NK1.1+/CD49b+ (NK) cell (n = 6) and CD3−/NK1.1+/CD49a+ cell (ILC1) (n = 4) populations obtained from the meninges. c) Immunofluorescence analysis of the percentage of ChAT+ NK cells collected from the blood of healthy donors (n = 6). Scale bar: 5 μm. For boxplots (a–c) the center line, boxes and whiskers represent the median, inner quartiles, and rest of the data distribution, respectively. d Left: Scheme of ACh intracerebral administration in C57BL/6 mice. Right: Expression of ACh in the hypothalamus of mice treated with IgG or aNK1.1 (n = 6 mice per condition, *p = 0.036 two-tailed Student’s t test). Left: Scheme of hypothalamus-VTA-hippocampus circuit. e Expression of DA in the hippocampus of mice treated with IgG or aNK1.1 (n = 6 mice per condition, **p < 0.001 two-tailed Student’s t test). f Microdialysis of basal DA in the hippocampus of IgG- (n = 6) or aNK1.1-treated (n = 9 mice, **p = 0.005 one-way ANOVA). g Expression of ACh in the hypothalamus of Rag2−/− and Rag2−/−γc−/− mice (n = 6 mice per group, **p = 0.002 two-tailed Student’s t test). h Expression of DA in the hippocampus of Rag2−/− and Rag2−/−γc−/− mice (n = 6 mice per condition, *p = 0.019 two-tailed Student’s t test). For boxplots (d–h), the center line, boxes and whiskers represent the median, inner quartiles, and rest of the data distribution, respectively. i Immunohistochemistry demonstrating c-Fos expression in orexin hypotalamic neurons and in VTA dopaminergic neurons following behavioral test in IgG- or aNK1.1-treated mice. Center: quantification of c-Fos+ cells express as percentage of total Orx+ or TH+ neurons in the different areas (n = 6 mice per condition; **p < 0.001, two-tailed Student’s t test. Scale bar: 50 μm). Data are expressed as mean ± SEM. (d, i) Figure created with BioRender.com.

