Figure 3.
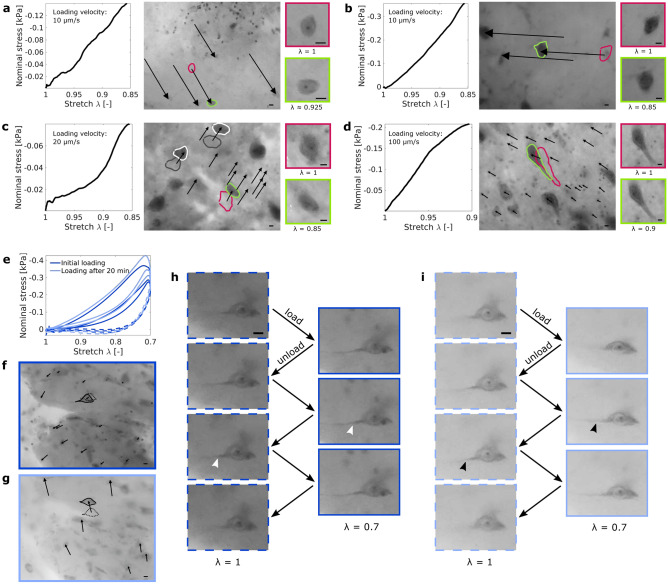
Cell body deformation during initial (a–d) and repetitive (e–i) loading. (a) shows a deforming cell body in a sample from the porcine putamen and (b–d) show deforming cell bodies in the porcine brain stem. Arrows point from the initial location of selected cell nuclei to their final location at maximum strain (deformation) . Red lines indicate the initial shape of a deforming neuron, green lines the deformed shape at maximum strain. The quadratic images show magnified views of the undeformed (red frame) and deformed (green frame) neurons. In (c), two neurons that remained undeformed are exemplarily shown (gray line initial shape, white line shape at maximum strain). (e–i) show the deformation of a cell body in the porcine putamen during repetitive cyclic compression. The sample was able to recover its initial stiffness after a 20 min recovery period (e), but the displacement field after recovery (g) was different from the displacement field during the initial experiment (f). In (f) and (g), black arrows point from the initial location of cell nuclei to their final location at maximum strain (deformation) %. The neuron shown in (h) remained undeformed during the initial loading. One of its neurites is visible (white arrowheads) and does not change its course during loading. After the recovery period, the shape of the neuron and the angle of its neurite (black arrowheads) changed under loading (i). The dark blue color indicates the initial experiment, the lighter shade of blue the second experiment after recovery. Dashed lines represent the unloaded state, solid lines the loaded state. Scale bars 10 µm.

