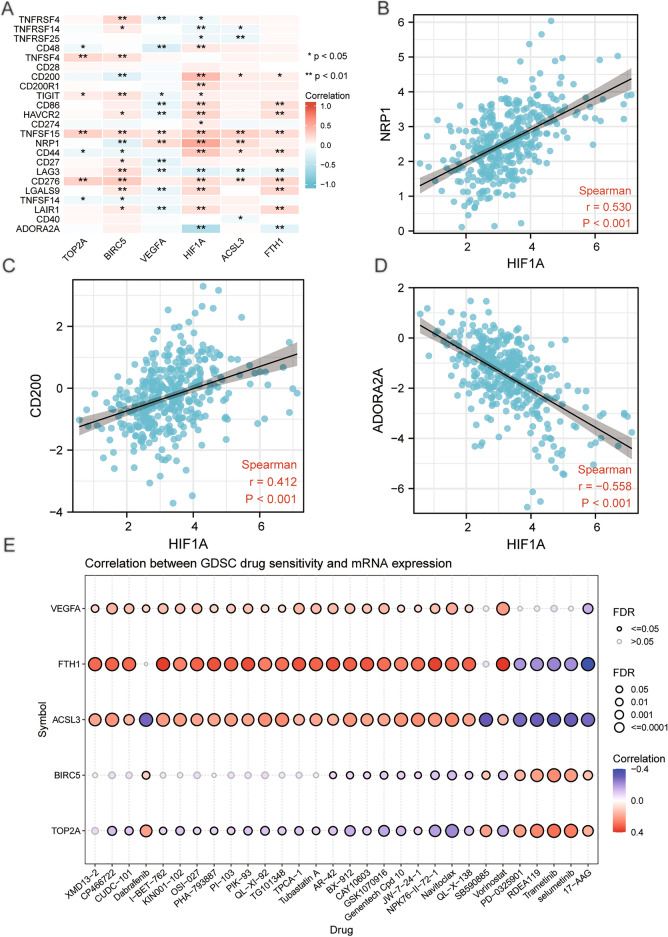
Figure 11.
Heatmap, scatter plot and drug-sensitivity bubble plot of correlation analysis for the prognosis-related genes and immune checkpoint. (A)Heatmap of correlation analysis for the gene signature and immune checkpoint. (B) Scatter plot of correlation between gene HIF1A and immune checkpoint NRP1, (C) HIF1A and immune checkpoint CD200, (D) HIF1A and immune checkpoint ADORA2A. (E) Drug-sensitivity bubble plot for the correlation between gene VEGFA, FTH1, ACSL3, BIRC5, TOP2A and drug IC50. FDR: false discovery rate. ns P ≥ 0.05, *P < 0.05, **P < 0.01, ***P < 0.001.

