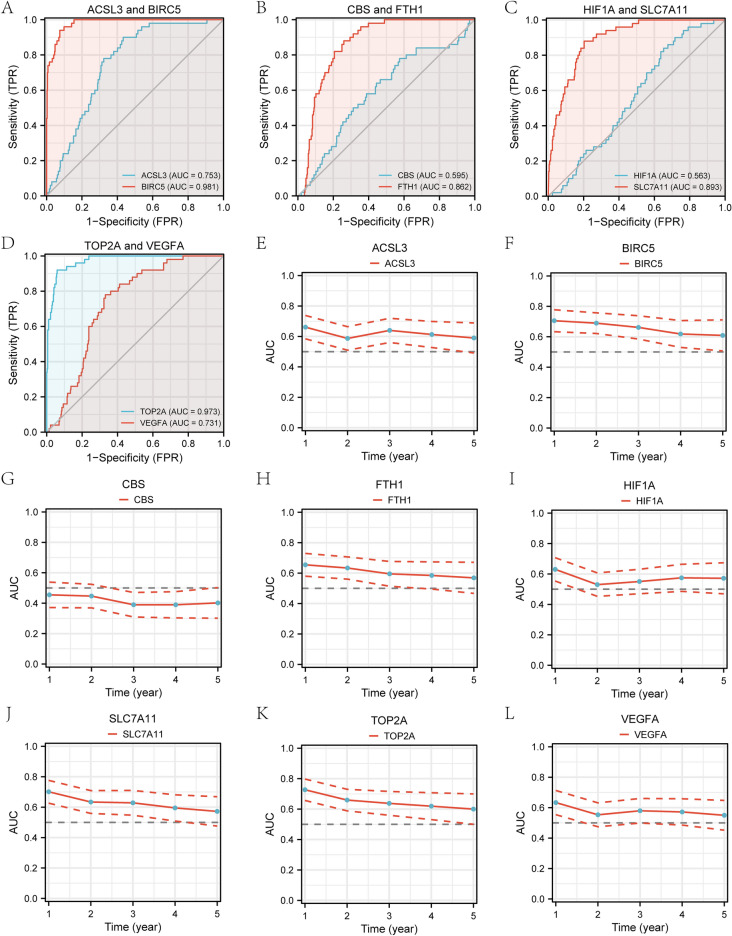
Figure 3.
ROC curves and time-dependent ROC line charts for prognosis-related ferroptosis and drug-resistant genes. (A–D)Prognostic ROC curves for genes ACSL3, BIRC5, CBS, FTH1, HIF1A, SLC7A11, TOP2A, VEGFA. (E–L) Time-dependent ROC line charts for genes ACSL3, BIRC5, CBS, FTH1, HIF1A, SLC7A11, TOP2A, VEGFA. ROC: receiver operating characteristic curve; AUC: Area Under Curve.

