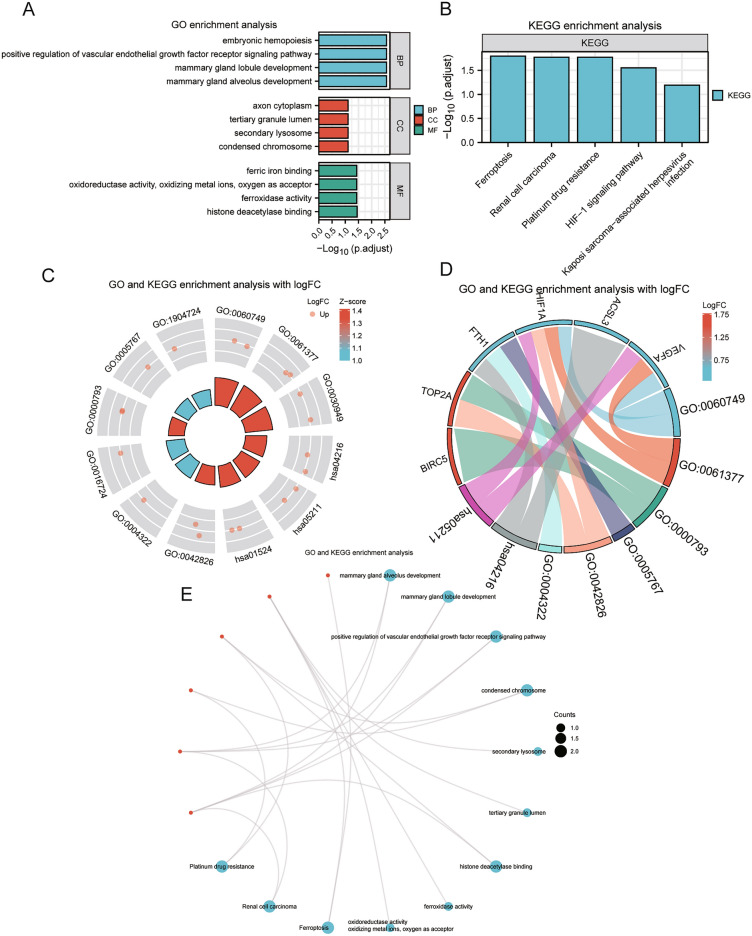
Figure 5.
GO and KEGG analysis of differentially expressed prognosis-associated ferroptosis and drug-resistant genes. (A) Bar chart of GO analysis for the genes. (B) Bar chart of pathway enrichment (KEGG) analysis results for the genes. (C) Circle plot of the GO analysis and KEGG analysis combined with logFC results for the genes. (D) Chord plot of GO analysis and KEGG analysis combined with logFC results for the genes. (E) Ring network of GO analysis and KEGG analysis results for the genes. GO: Gene Ontology; BP: biological process; CC: cellular component; MF: molecular function; Up: up-regulated genes; Down: down-regulated genes.

