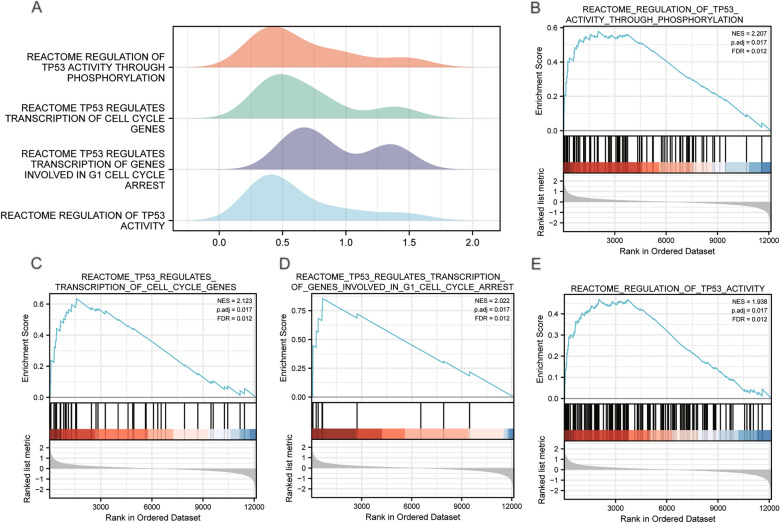
Figure 6.
GSEA enrichment analysis of the TCGA-LIHC dataset. (A) The Ridge plot of GSEA analysis for Top4 biological functions in TCGA-LIHC dataset. (B) Visualization chart of GSEA enrichment analysis results of TCGA-LIHC genes in high and low risk groups (group: high and low) with REACTOME_ REGULATION_OF_TP53_ACTIVITY_ THROUGH_PHOSPHORYLATION, (C) REACTOME_TP53_REGULATES_ TRANSCRIPTION_OF_CELL_ CYCLE_GENES, (D) REACTOME_ TP53_REGULATES_ TRANSCRIPTION_OF_GENES_INVOLVED_IN_G1_CELL_CYCLE_ARREST, (E) REACTOME_ REGULATION_ OF_TP53_ ACTIVITY. GSEA: Gene Set Enrichment Analysis; NES: Normalized Enrichment Scores; FDR: false discovery rate; NES: normalized enrichment score.

