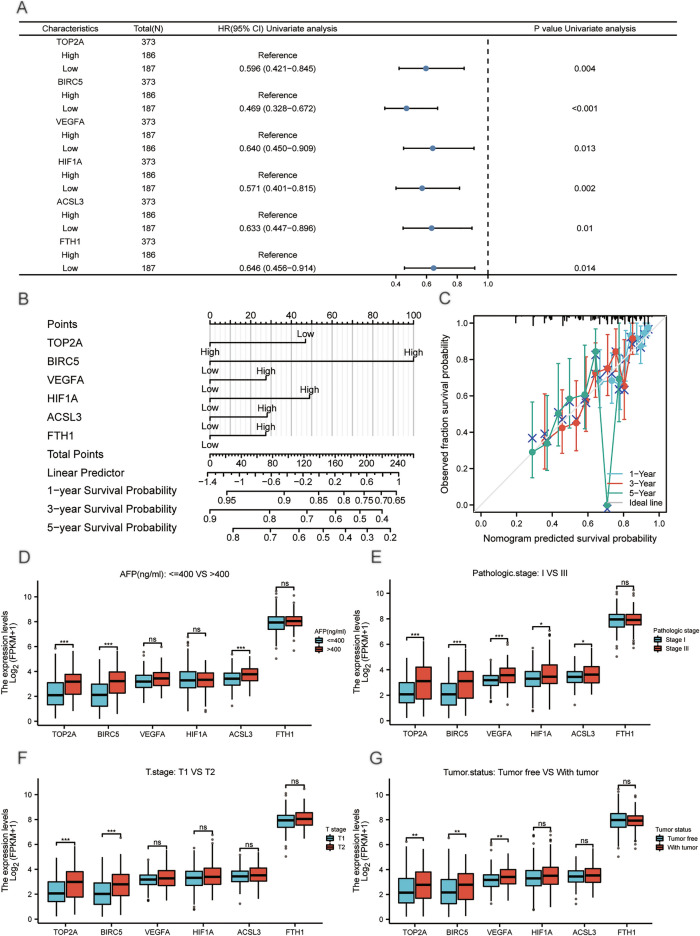
Figure 9.
Forest plot, Alignment diagram, Calibration analysis and group comparison plots of clinical correlation. (A) The Forest plot of univariate cox regression analysis of differentially expressed prognosis-related ferroptosis and drug-resistant genes (B) Alignment diagram (C) 1, 3, and 5-years calibration curves. (D) Group comparison plots of differentially expressed prognosis-related ferroptosis and drug-resistant genes in clinical groups of AFP (ng/ml): < = 400 and > 400, (E) pathologic stage: Stage I and Stage III, (F) T stage: T1 and T2, (G) tumor status: Tumor free and With tumor. ns P ≥ 0.05, *P < 0.05, **P < 0.01, ***P < 0.001.

