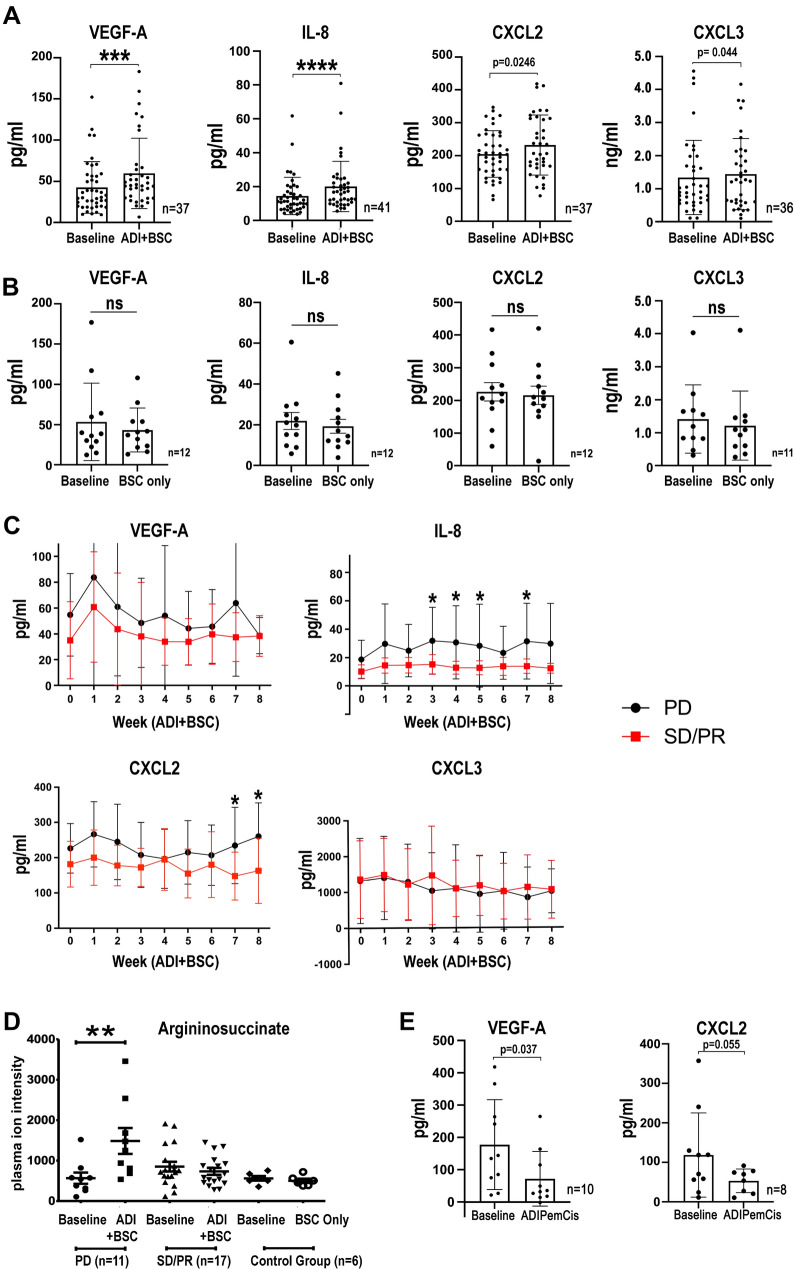
Fig. 5.
Clinical validation of cytokine signature and argininosuccinate. A Plasma VEGF-A, IL-8, CXCL2, and CXCL3 concentrations of patients on the ADAM study randomized to ADI-PEG20 and BSC compared with baseline levels; and B control patients randomized to BSC alone compared to baseline levels (IL-1α not detected in either group). Bar values represent mean and standard deviation: *p < 0.05, ***p < 0.001, ****p < 0.0001; Wilcoxon signed-rank test. C Plasma cytokine concentrations in patients whose disease had progressive disease (PD) compared with patients who had stable disease/partial response (SD/PR) at the 8 week assessment by CT imaging were analyzed in the ADI-PEG20 plus BSC treatment group. Data represent mean values with standard deviation: *p < 0.05; two-way ANOVA followed by Sidak’s multiple comparison’s test, VEGF-A (F1,317 = 12.25, df = 1; p < 0.0005), IL-8 (F1,318 = 56.46, df = 1; p < 0.0001), CXCL2 (F1,295 = 31.0, df = 1; p < 0.0001), and CXCL3 (F1,281 = 0.9333, df = 1; p = 0.335). D Argininosuccinate was detected in plasma from all patients and was only significantly increased in the ASS1-deficient patients with disease progression by week 8 of ADI-PEG20 plus BSC treatment, whereas levels were unchanged in patients displaying SD/PR as analyzed by CT imaging. **p < 0.01; by two-way ANOVA. E Plasma VEGF-A and CXCL2 concentrations of patients receiving ADI-PEG20 plus chemotherapy compared with baseline levels within the first 2 months on the TRAP study. Bar values represent mean and standard deviation: *p < 0.05; Wilcoxon signed-rank test

