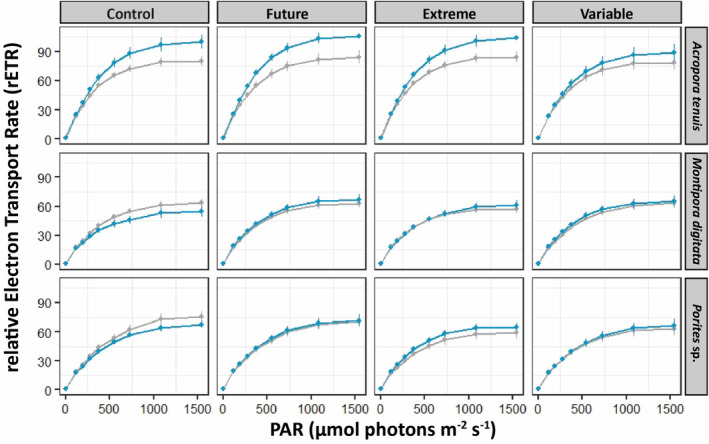
FIGURE 3.

Relative electron transport rate (rETR) measured during RLC curves of corals after 100 days of incubation at four pH conditions (Control, pHNBS 8.11; Future, pHNBS 7.76; Extreme, pHNBS 7.54; and Variable, pHNBS 7.56–8.07). Bouraké corals are in blue, while reference corals are in gray. Data are mean ± SE; n = 12–16, depending on species and pH condition; see Table S7 for all post hoc comparisons.
