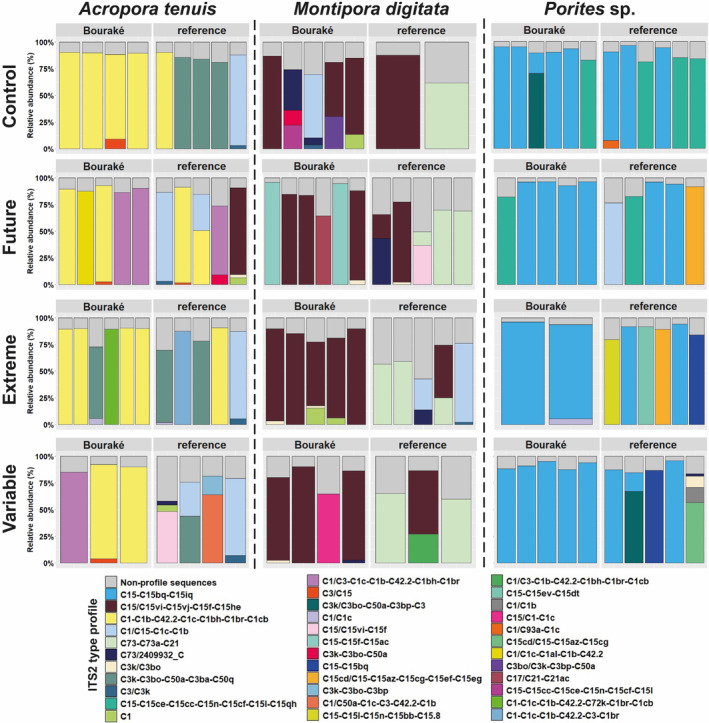
FIGURE 6.

Predicted major ITS2 type profiles of corals from Bouraké and the reference site after 100 days of incubation at four pH conditions (Control, pHNBS 8.11; Future, pHNBS 7.76; Extreme, pHNBS 7.54; and Variable, pHNBS 7.56–8.07). Within each cell of this 3‐by‐4 matrix, samples are plotted as stacked bar charts with a single column representing a sample from a specific origin: Bouraké (left) and reference (right). The number of individuals per condition varies from 2 to 6 depending on the number of samples available.
