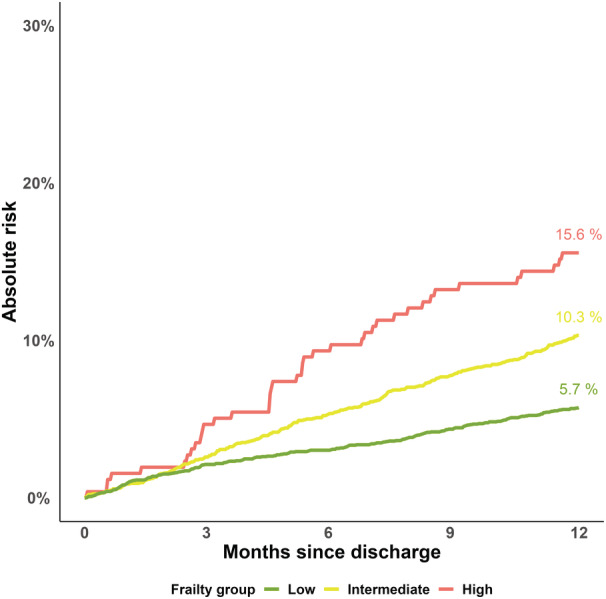
Figure 3. Risk of death.

The 1‐year risk of death according to frailty. The x axis represents months since transcatheter aortic valve replacement discharge. The y axis depicts the absolute risk of death. In the low frailty group, 5.9% died within 1 year compared with 16.1% in the high frailty group. As such, mortality is incrementally higher across frailty groups.
