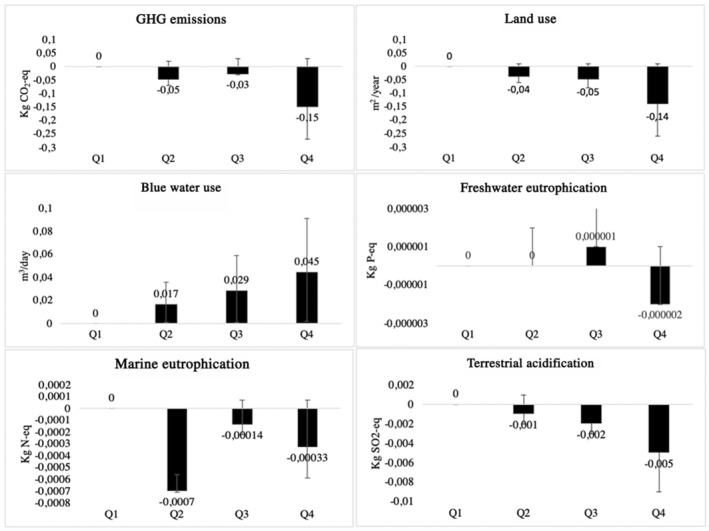
Figure . Regression coefficients and 95% CIs for the association between quartiles of the HRDea score and environmental indicators, adjusted for age, sex, and energy intake (n=35 496).

GHG indicates global greenhouse gas; HRDea score, energy‐adjusted healthy reference diet score; Kg CO2‐eq = kilograms of carbon dioxide equivalent; Kg N‐eq, kilograms of nitrogen equivalent; Kg P‐eq, kilograms of phosphorus equivalent; Kg SO2‐eq, kilograms of sulfur dioxide equivalent; m2 per year, square meters per year; m3 per day, cubic meters per day; Q1, first quartile; Q2, second quartile; Q3, third quartile; and Q4, fourth quartile.
