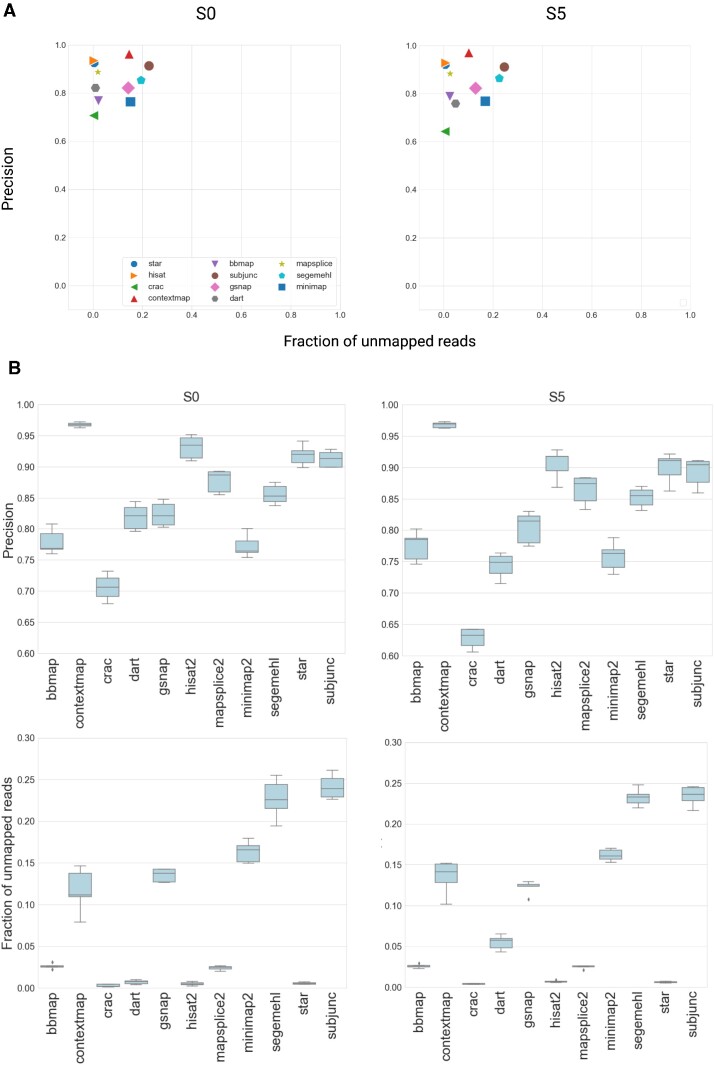
Figure 2.
(A) The plots for precision and fraction of unmapped reads plots for splice-aware mapping tools for the data sets S0 and S5. The results for S1–S4 are presented in Supplementary Figure S3. The values are taken from the analysis of one out of five simulated datasets as an example. (B) The boxplots for precision and fraction of unmapped reads for splicing-aware mapping tools calculated for S0 (repeated 5 times) and S5 (repeated 5 times)

