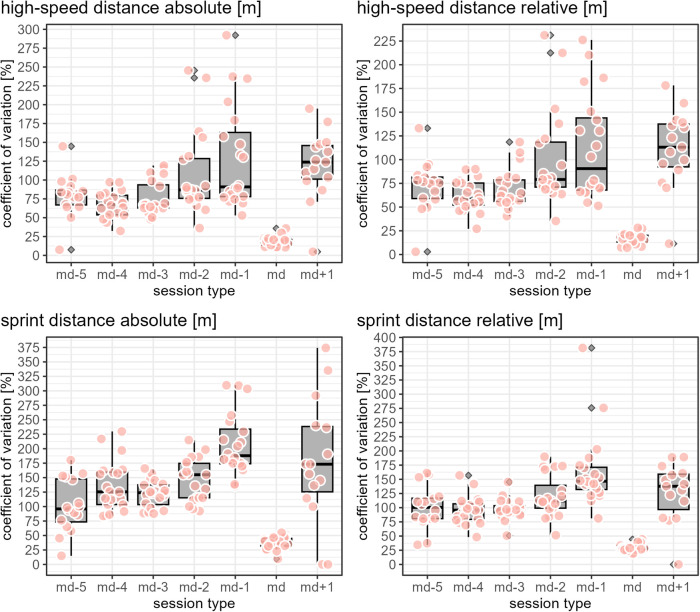
Figure 5.
The apricot-blushed-like filled data points show the coefficient of variation by player and day in a microcycle for the respective load measure. The boxplots display the distribution of the players' coefficients of variations per day in a microcycle, with the grey filled diamonds indicating outliers (values further than 1.5 * inter-quartile range from the hinge).

