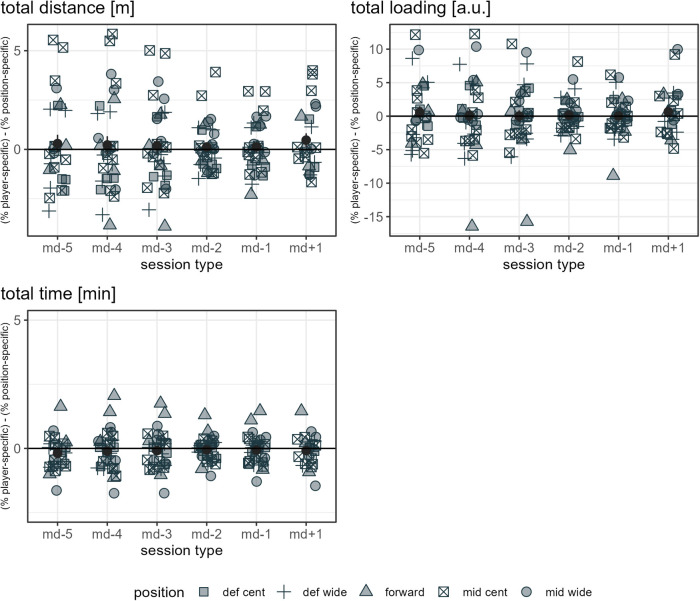
Figure 9.
The data points listed in the figure legend show the mean observed difference between the respective player-specific ratio and the respective player-position ratio by player and day in a microcycle for the respective load measure, specifying a player's position. The dark grey dots indicate the mean of all players' mean differences per day in a microcycle, and the dark grey error bars range from mean minus standard error to mean plus standard error. Def cent, central defender; def wide, full back; mid cent, central midfielder; and mid wide, wide midfielder.

