Figure 5.
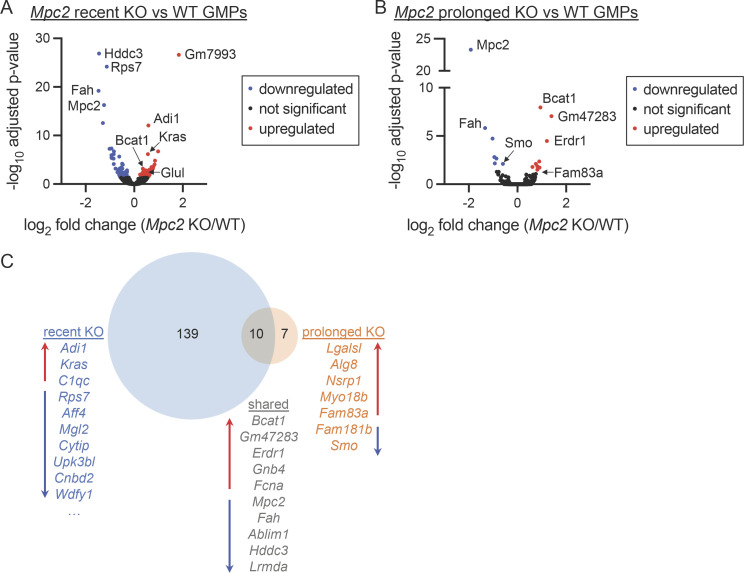
GMPs differentially express numerous genes immediately following Mpc2 deletion but few persist following myeloid recovery. (A and B) Volcano plots of gene expression fold changes between Mpc2 recent KO and WT GMPs (A) or Mpc2 prolonged KO and WT GMPs (B). Following RNA-seq, adjusted P values were calculated using DESeq2. Each dot represents a gene. Recent Mpc2 KO mice were pooled into groups of two mice to obtain a sufficient number of cells. A total of 10 mice were used but were processed as five samples. For all other groups, five mice were analyzed without pooling for each genotype. (C) Venn diagram analysis depicting genes differentially expressed by only recent Mpc2 KO GMPs, prolonged Mpc2 KO GMPs, or both relative to WT GMPs. Lists of genes include all hits or the top 10 hits not including pseudogenes or predicted genes. Red up arrows indicate genes upregulated in KOs relative to WT, while blue down arrows indicate genes downregulated in KOs relative to WT. All data are available in the NCBI GEO (recent KO accession number GSE225578 and prolonged KO accession number GSE184548).

