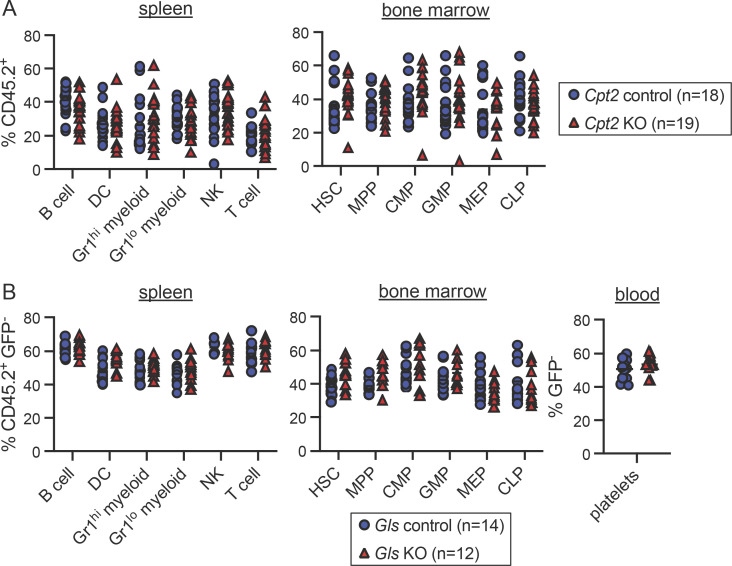
Figure S2.
Raw chimerism frequencies for Cpt2 and Gls chimeras. (A) Raw chimerism values for Cpt2 chimeras shown in Fig. 1 C. Each symbol represents an individual mouse. Mean values ± SEM are shown, and data are pooled from three independent experiments. P values >0.05 by two-way ANOVA with post-hoc Tukey’s multiple comparisons test are not depicted. (B) Raw chimerism values for Gls chimeras shown in Fig. 1 D. Each symbol represents an individual mouse. Mean values ± SEM are shown, and data are pooled from two independent experiments. P values >0.05 by two-way ANOVA with post-hoc Tukey’s multiple comparisons test are not depicted.

