Figure S4.
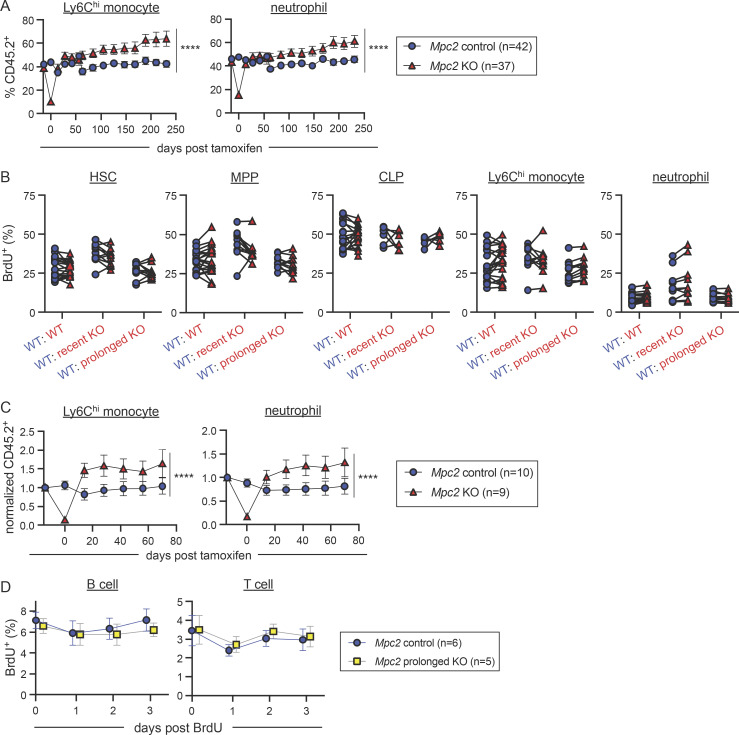
Proliferation, survival, and recovery of MPC2-deficient cells. (A) Raw chimerism values for peripheral myeloid cells of Mpc2 chimeras in Fig. 3 A. Data are pooled from three independent experiments. Mean values ± SEM are shown. ****, P < 0.0001 by paired two-way ANOVA with post-hoc Tukey’s multiple comparisons test. (B) BrdU incorporation was measured in both CD45.1+ (WT) and CD45.2+ (WT, recent Mpc2 deletion, or prolonged Mpc2 deletion) HSCs, MPPs, CLPs, Ly6Chi monocytes, and neutrophils following a 1-h pulse of BrdU. Each line connects CD45.1+ and CD45.2+ cells within the same mouse (n = 11 for WT chimeras and n = 19 for recent and prolonged KO chimeras). Data are pooled from two independent experiments. P values >0.05 by paired two-way ANOVA with post-hoc Sidak’s multiple comparisons test are not depicted. (C) Mpc2 chimeras were setup at a ratio of 90% WT to 10% Mpc2fl/fl; ROSA26 CreER−/− or CreER+/− bone marrow cells (as opposed to the 1:1 ratio in Fig. 3). CD45.2 peripheral blood chimerism of Ly6Chi monocytes and neutrophils was assessed every 2 wk in Mpc2 chimeras. Values are normalized to pre-tamoxifen chimerism of each cell type. Mean values ± SEM are shown. ****, P < 0.0001 by paired two-way ANOVA with post-hoc Tukey’s multiple comparisons test. (D) BrdU incorporation was measured in peripheral CD45.2+ B and T cells for 3 d following a week of BrdU water administration. Mean values ± SEM are shown. Data are pooled from two independent experiments. P values >0.05 by two-way ANOVA with post-hoc Tukey’s multiple comparisons test are not depicted.

