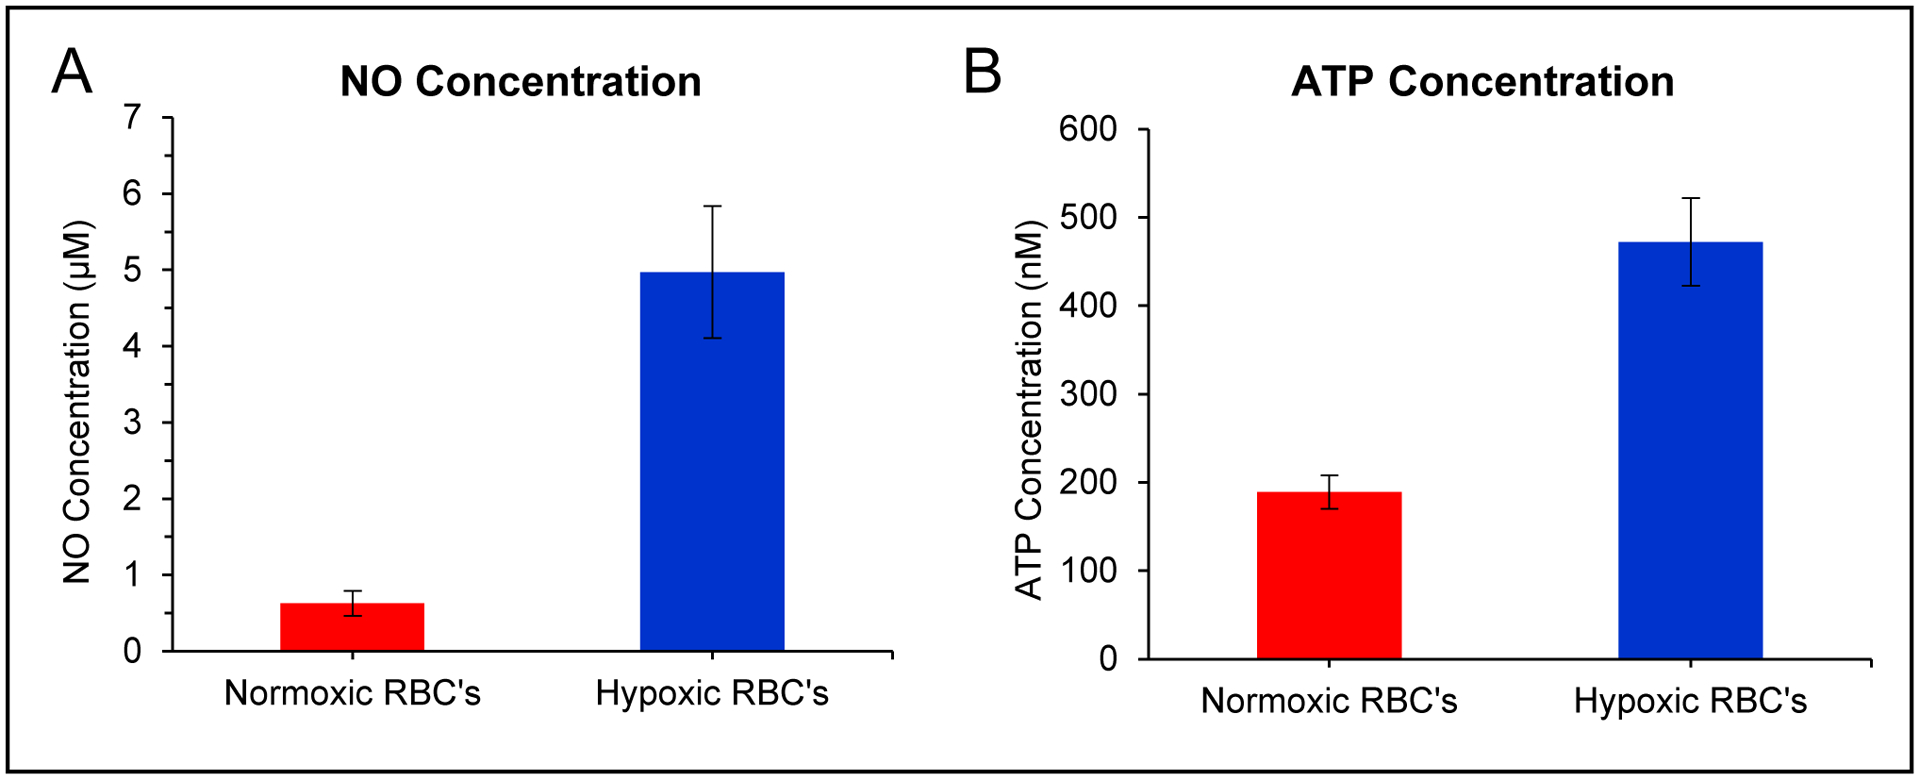
Figure 5.

Use of multi-modal device to quantitate NO and ATP release from healthy RBCs. A) Bar graph showing average NO concentrations from normoxic and hypoxic RBCs (7% solution, n=11 different donations, error = SEM). B) Bar graph showing average ATP concentrations from normoxic and hypoxic RBCs (7% solution, n=10 different donations, error = SEM).
