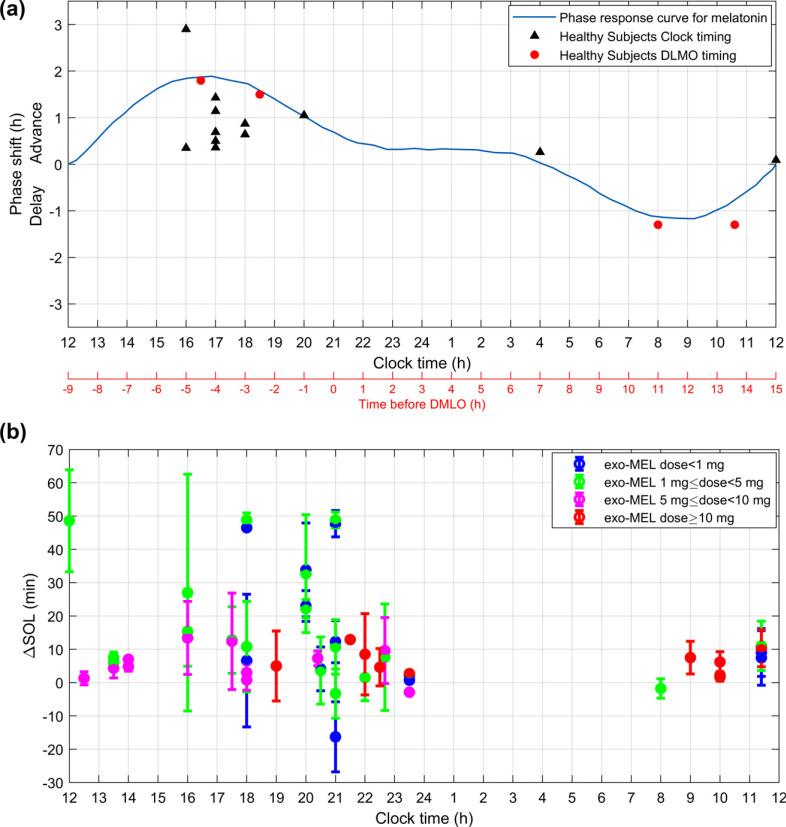
Fig. (3a).
Chronobiotic effect of exogenous melatonin. Studies evaluating the phase-shift effect of exo-MEL on the DLMO in healthy subjects. The results are expressed as the difference (Δ) between the DLMO phase shift induced by the placebo and that induced by exo-MEL. When the Δ phase-shift was not reported directly, the phase shift to exo-MEL reported by each study was corrected by subtracting the phase shift of the placebo condition. Each study Δ phase-shift was plotted against the time of the exo-MEL administration, discriminating by those studies that established the timing of administration based upon the clock-time (black triangles) and those that reported the timing of administration in relation to the baseline DLMO (red circles). Each study contributed one point to the PRC. The studies plotted are described in Appendix Table 1 and highlighted with an asterisk (*). The theoretical PRC of MEL was plotted based on From Eastman CI, Burgess HJ et al. (2009)[190]. Fig. (3b). Sleep-promoting effect of exogenous melatonin. Summary of the results reported by studies evaluating the exo-MEL effect as sleep-promoting as measured through the sleep onset latency (SOL) in healthy subjects. The results are expressed as the difference (Δ) between the SOL induced by the placebo and that induced by exo-MEL. Each study ΔSOL was plotted against the time of the exo-MEL administration. The exo-MEL posology was divided as dose less than 1mg (blue), dose between 1mg and 5 mg (green), a dose between 5 mg and 10mg (magenta), and dose greater than 10mg (red). Each study protocol was plotted separately so that studies using several timings of administration and different dosages were plotted differentially. The studies plotted are described in Appendix Table 2 and highlighted with an asterisk (*).

