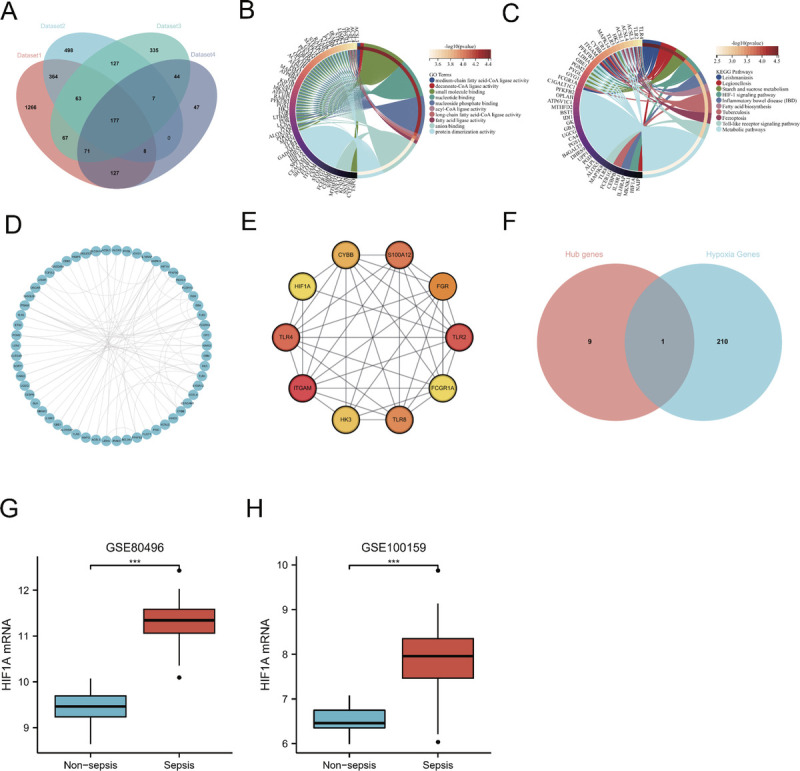
FIG. 2.

Identification and validation of hypoxia-related hub genes. A, A Venn diagram program was used to reflect the intersection between WGCNA candidate genes and upregulated DEGs in GSE100159 and GSE80496 data sets. B, The GO enrichment analysis of intersection genes. C, The KEGG enrichment analysis of intersected genes. D, The PPI network of intersected genes, including ITGAM, TLR2, TLR4, S100A12, TLR8, FGR, CYBB, HK3, HIF-1α, and FCGR1A. E, The PPI network of hub genes. F, The intersections of hub genes and hypoxia gene set. G and H, The HIF-1α mRNA expression level in the sepsis is significantly higher than that in the nonsepsis group (P < 0.001) (GSE80496, GSE100159).
