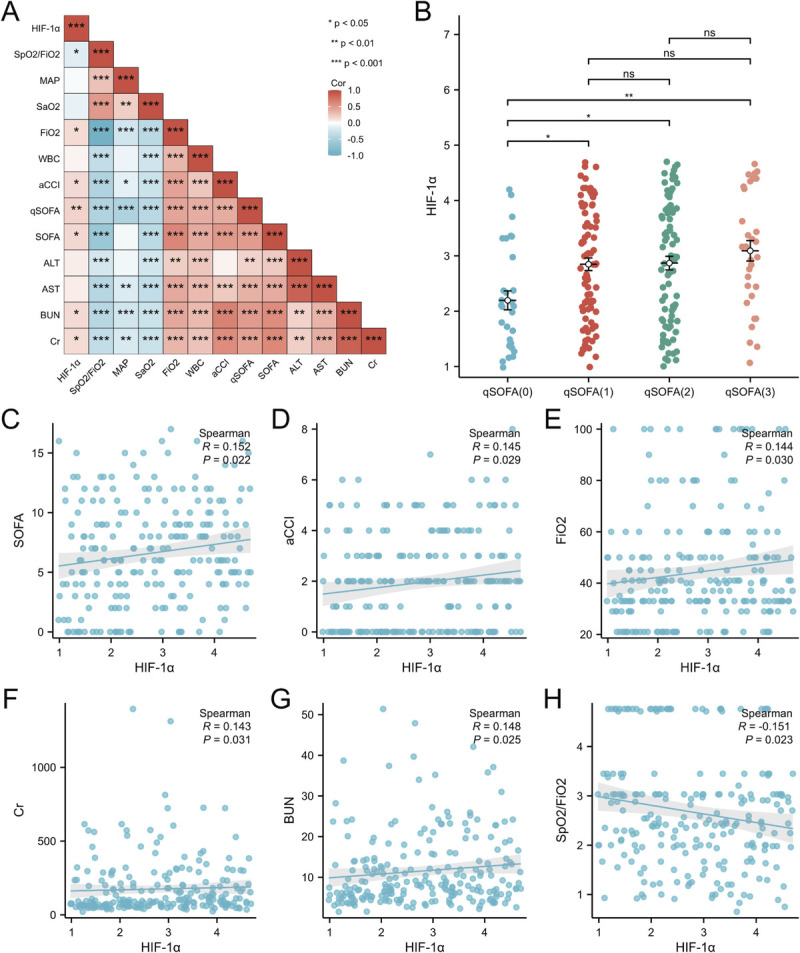
FIG. 4.

The association of HIF-1α protein levels, clinical characteristics, and clinical prognosis. A, The Spearman rank correlation test was used for exploration of the correlations. Positive correlations are illustrated by red squares; negative correlations are presented by blue squares. B, Hypoxia-inducible factor 1α distributions for different qSOFA score-based subgroups (2.09 [1.40–2.83] vs. 2.84 [2.04–3.77] vs. 2.94 [1.83–3.84] vs. 3.13 [2.40–4.22], P < 0.01, P [overall] = 0.0063) (*P < 0.05, **P < 0.01, ***P < 0.001). C, The relationship between SOFA score and HIF-1α level. D, The relationship between aCCI score and HIF-1α level. D, The relationship between FIO2 and HIF-1α level. F, The relationship between Cr level and HIF-1α level. G, The relationship between BUN level and HIF-1α level. H, The relationship between SpO2/FIO2 and HIF-1α level.
