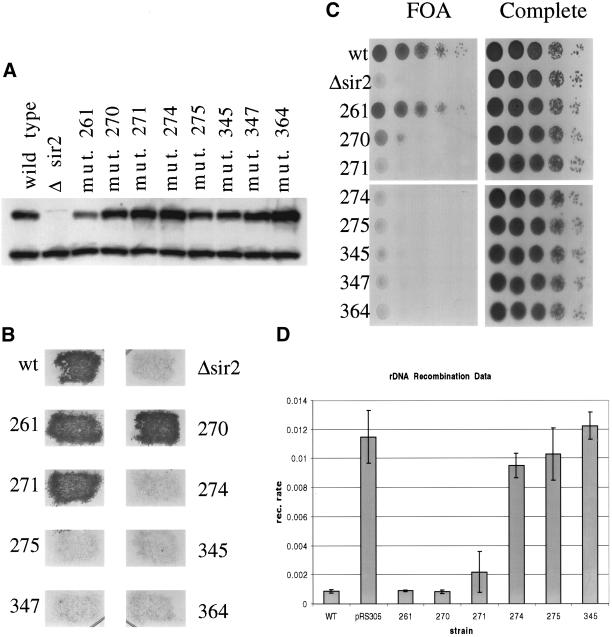
Figure 3.
Testing sir2 mutant phenotypes in vivo. (A) Whole cell protein extracts were made from each of the indicated strains. Whole cell extract (15 μg) was run on a polyacrylamide gel and blotted to a polyvinylidene difluoride membrane for Western blot analysis. The blot was probed with anti-Sir2p to measure the level of Sir2p in each of the mutant strains. The upper band is the Sir2p band. (B) To investigate silencing at the HMLα locus, the mutant strains were mated with a mating tester strain and grown on selective media to select for diploids. (C) To test for telomere silencing, SIR2 was mutated in a strain background with the URA3 marker at the end of telomere VII. Each mutant strain was tested for its ability to silence the marker by growing on media containing 5-FOA (a substrate that is toxic to yeast expressing URA3). (D) rDNA recombination rates were measured in a strain background with the ADE2 marker located in the rDNA array. The rate of marker loss was measured for each mutant by counting the number of colonies that lost the marker in the first generation after plating.

