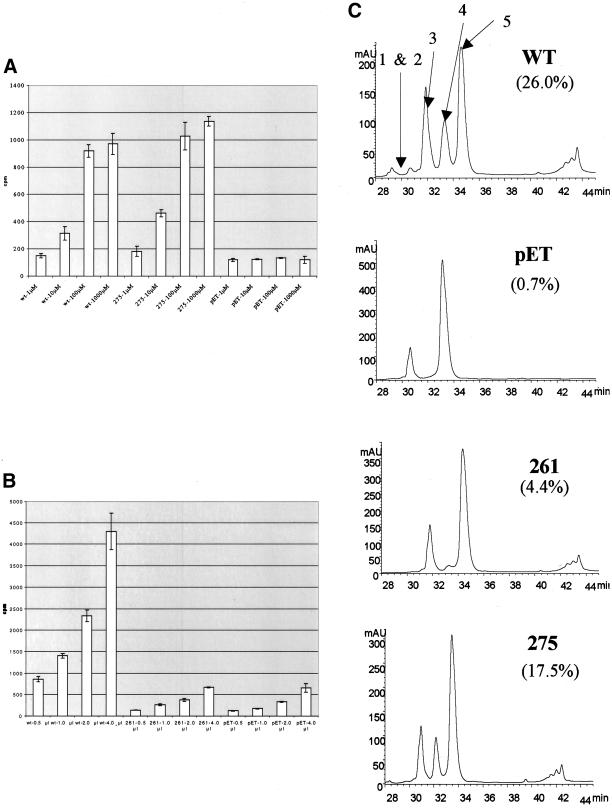
Figure 5.
Histone deacetylation activity of mutants under different NAD+ and peptide concentrations. (A) Histone deacetylation activity of mutant 275 along with wild-type Sir2p and no enzyme control was measured using tritiated H4 peptide that was incubated with enzyme and concentrations of NAD+ ranging from 1 μM to 1 mM. Deacetylation activity was measured by counting the amount of free acetate removed during the reaction. (B) Histone deacetylation activity of mutant 261 along with wild-type Sir2p and no enzyme was measured while the amount of tritiated peptide was varied from 0.5 to 4 μl. (C) HPLC chromatograms showing absorbance at 220 nm of products of deacetylation assays with yeast Sir2p, pET (no recombinant protein), mutant 261, and mutant 275 after a 1-h reaction. The efficiencies of the reactions are calculated as a fraction of the areas under peaks 1, 2, and 4 compared with the area under all of the peaks.

