
Fig. 10.
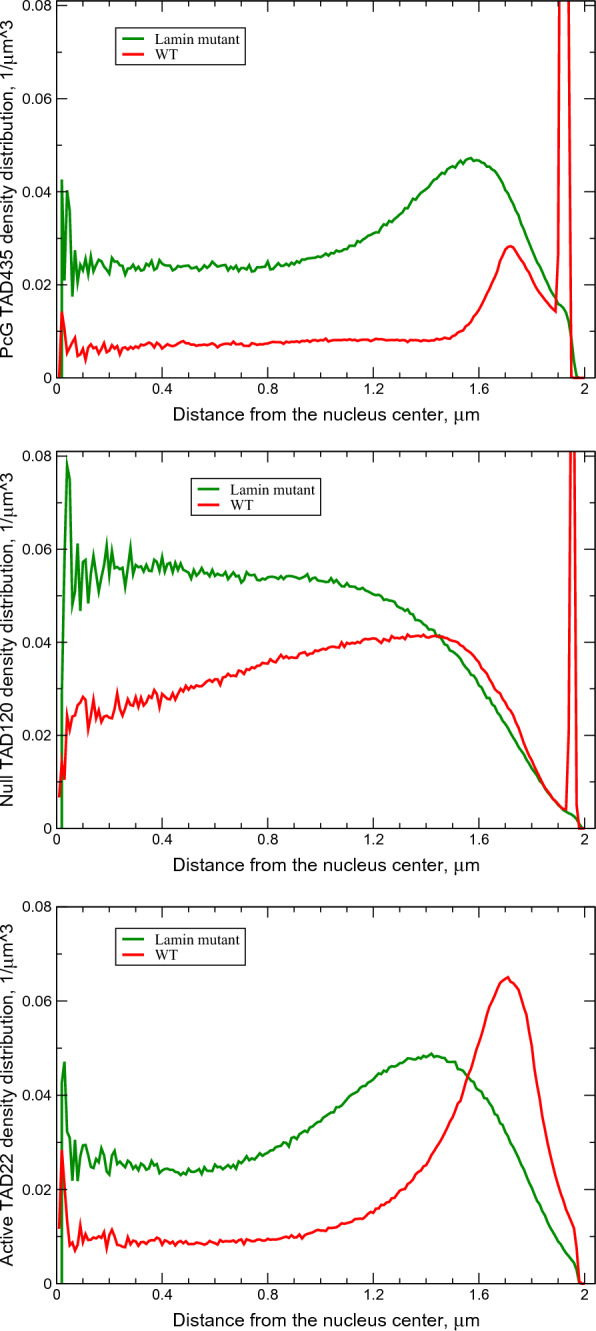
Examples of qualitatively different predicted radial distributions of several TADs, and their responses to lamin depletion. Top panel: Radial distribution of the PcG L-TAD #435 (cytological region 60D in Ref. [35]) in the WT and Lamin mutant nucleus models. Middle panel: Radial distribution of the Null L-TAD #120 (cytological region 36C in Ref. [35]) in the WT and Lamin mutant model nuclei. Bottom panel: Radial distribution of the Active TAD #22 in the WT and Lamin mutant model nuclei. The distributions of L-TADs (LADs) are bi-modal: the NE-bound mode is characterized by a high and very narrow density peak right at the NE, and the diffusive mode exhibits a noticeable LAD density in the nuclear interior. The bi-modality is consistent with the mobile nature of LADs