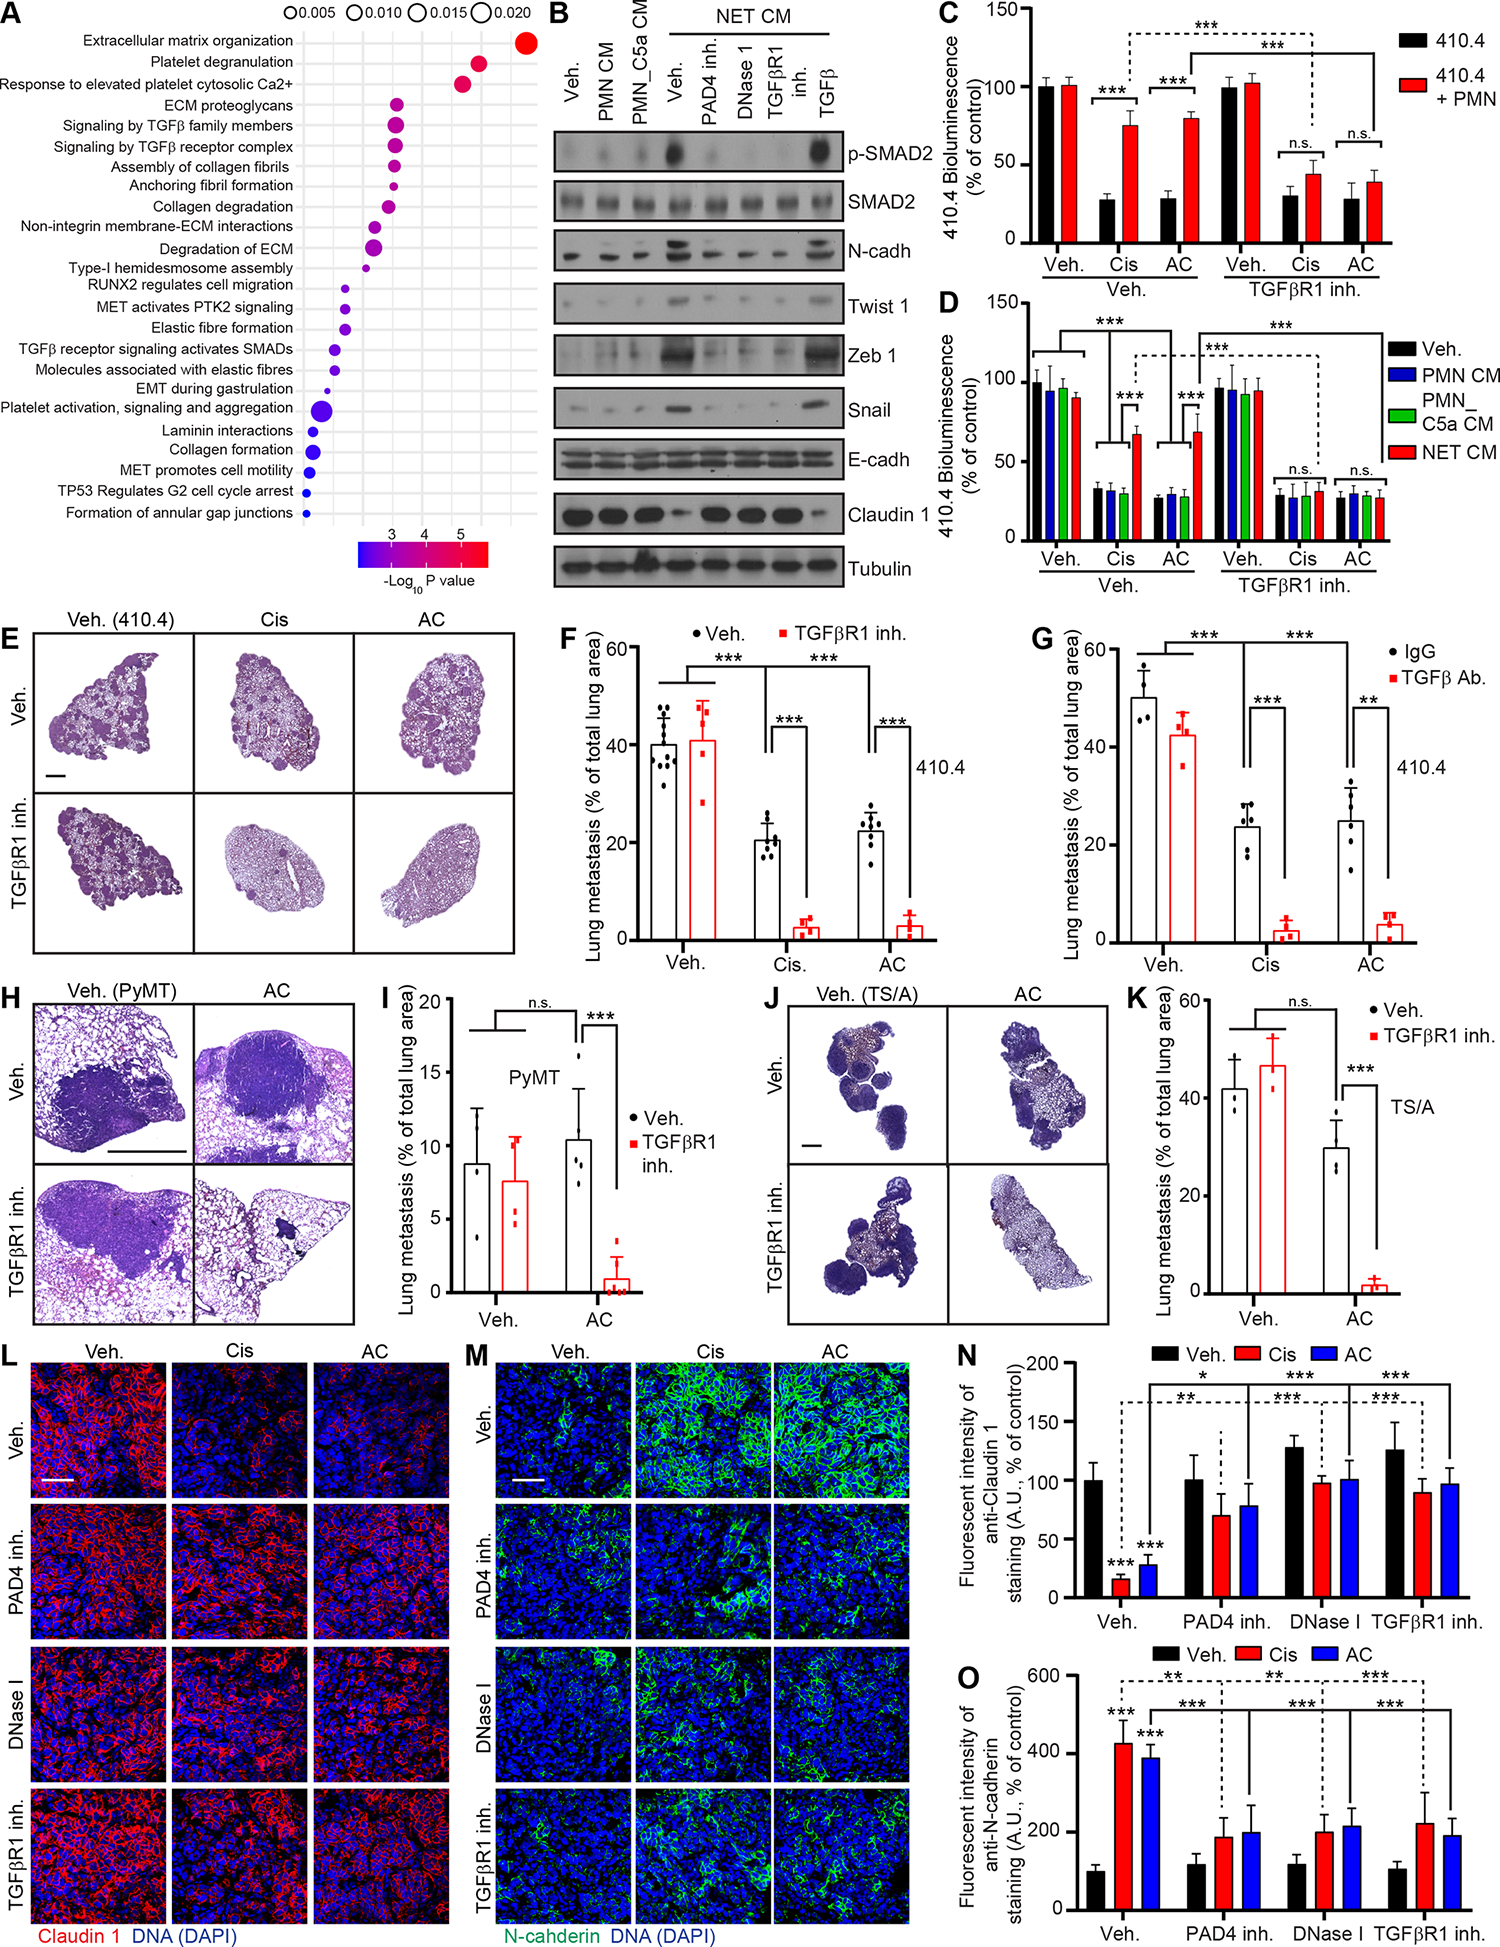
Figure 5. NETs promote chemoresistance through a TGFβ-dependent EMT in cancer cells.

(A) Gene ontology analysis of the genes that were uniquely up-regulated in 410.4 cells treated with NET CM for 48 hours. (B) Western blot for protein listed in 410.4 cells after 48 hours of indicated treatments. Results are representative of 2 independent experiments. (C) BLI signal from luciferase-expressing 410.4 cells cultured as indicated at day 2 (n=3; mean±SD). (D) BLI signal from luciferase-expressing 410.4 cells at day 2 after indicated treatments (n=3; mean±SD). (E, H, J) Representative images of H&E staining of lungs from animals injected intravenously with 410.4 (E), PyMT (H) or TS/A (J) cells treated as indicated. Scale bars: 1 mm. (F, G, I, K) Mice injected intravenously with 410.4 (F, G), PyMT (I) or TS/A (K) cells were treated for 21 days as indicated, and the lung metastatic burden was quantified from H&E staining (in (F) n=12 mice for the Veh. group, n=8 mice for the Cis and AC groups, n=5 mice for the TGFβR1 inh. group, n=4 mice for the other groups (the same Veh., Cis and AC groups were used for mice with 410.4 cells and treated with the CXCR2 inh. and the TGFβR1 inh.); in (G) n=6 mice for the Cis and AC groups and n=4 mice for the other groups; in (I) n= 4 mice for the Veh. and TGFβR1 inh. groups, n=5 mice for the AC group and n=6 mice for the AC + TGFβR1 inh. group (the same Veh. and AC groups were used for mice with PyMT cells and treated with the PAD4 inh., DNase I and the TGFβR1 inh.); in (K) n=4 mice for the AC group and n=3 mice for the other groups (the same Veh. and AC groups were used for mice with TS/A cells and treated with the PAD4 inh., DNase I and the TGFβR1 inh.); mean±SD). (L, M) Representative immunostaining of Claudin 1 (red, L), N-cadherin (green, M), and DNA (blue, DAPI) in the lung metastasis of mice injected intravenously with 410.4 cells and treated as indicated. Scale bar: 50 μm. (N, O) Quantification of images represented in (L) and (M) (n=3 mice per group; mean±SD).
Two-way ANOVA followed by Tukey’s procedure was used for (C, D, F, G, I, K, N, O). See also Figure S5.
