. 2023 Apr 7;23(11):2586–2600. doi: 10.1039/d2lc01113a

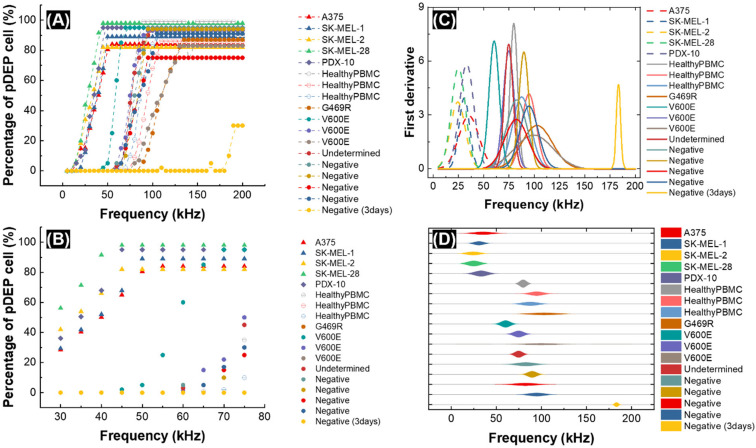
Fig. 2. A plot of the percentage of cells exhibiting a pDEP response in CF-DEP for melanoma cell lines (triangles), a patient-derived xenograft (diamonds), and PBMCs separated from healthy donor (open circles) and patient-derived (filled circles) blood samples is shown in (A). A zoom-in plot of the results in (A) from 30 kHz to 75 kHz (B). A normal distribution fitted to the pDEP response for each cell line (C) was used to select the optimal frequency (50 kHz) for CMC isolation. The dotted lines indicate melanoma cell lines and the solid lines indicate PBMCs from healthy donor and patient blood samples. A kite diagram of cellular pDEP response is plotted as a function of frequency in (D). Applied voltage: 6 Vpp.

Fig. 2