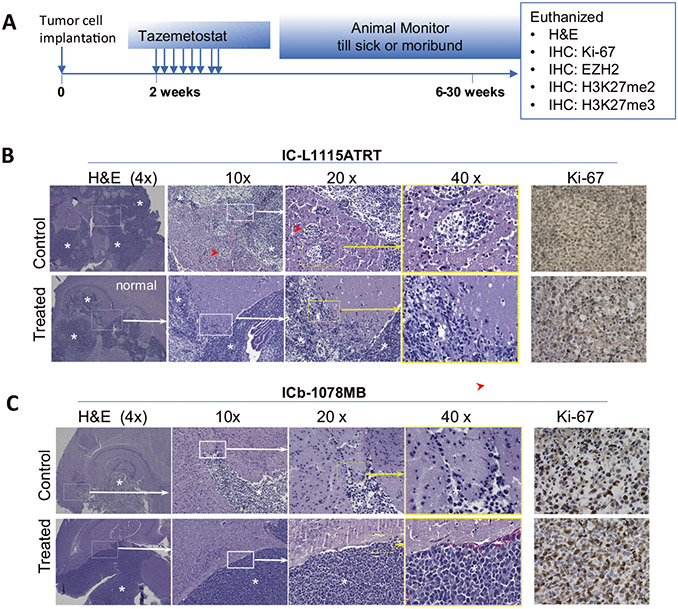
Fig. 4. Histological changes induced by tazemetostat.
A Schematic illustration of the timing of mouse brain collection after in vivo treatment. B H&E staining showing the in vivo growth of PDOX tumors (*) from low (4×) to high (40×). Compared with the untreated control, the remnant tumor of IC-L1115ATRT remained highly invasive although the number of satellite foci (red arrowhead) was slightly reduced (upper panel). The local invasion of IC-1078MB was not significantly affected (lower panel). Cell proliferation (Ki-67) in the remnant tumor was similar to the untreated controls.

