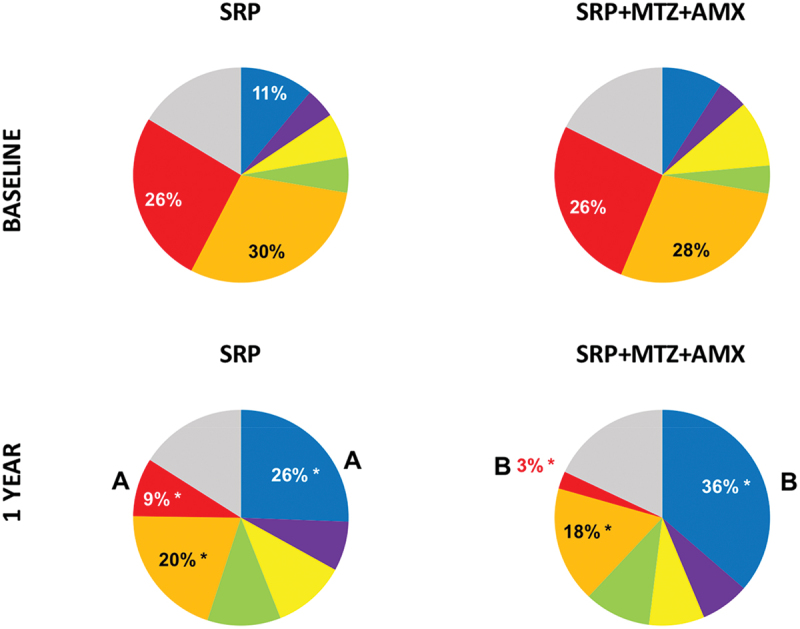
Figure 5.

Mean proportions of the microbial species described by Socransky et al. [3] in the two treatment groups at baseline and 1 year. The significance of differences between groups was determined by the Mann-Whitney test (different letters = p < 0.05), and within each group (between the two time points) by the Wilcoxon test (*p < .05).
