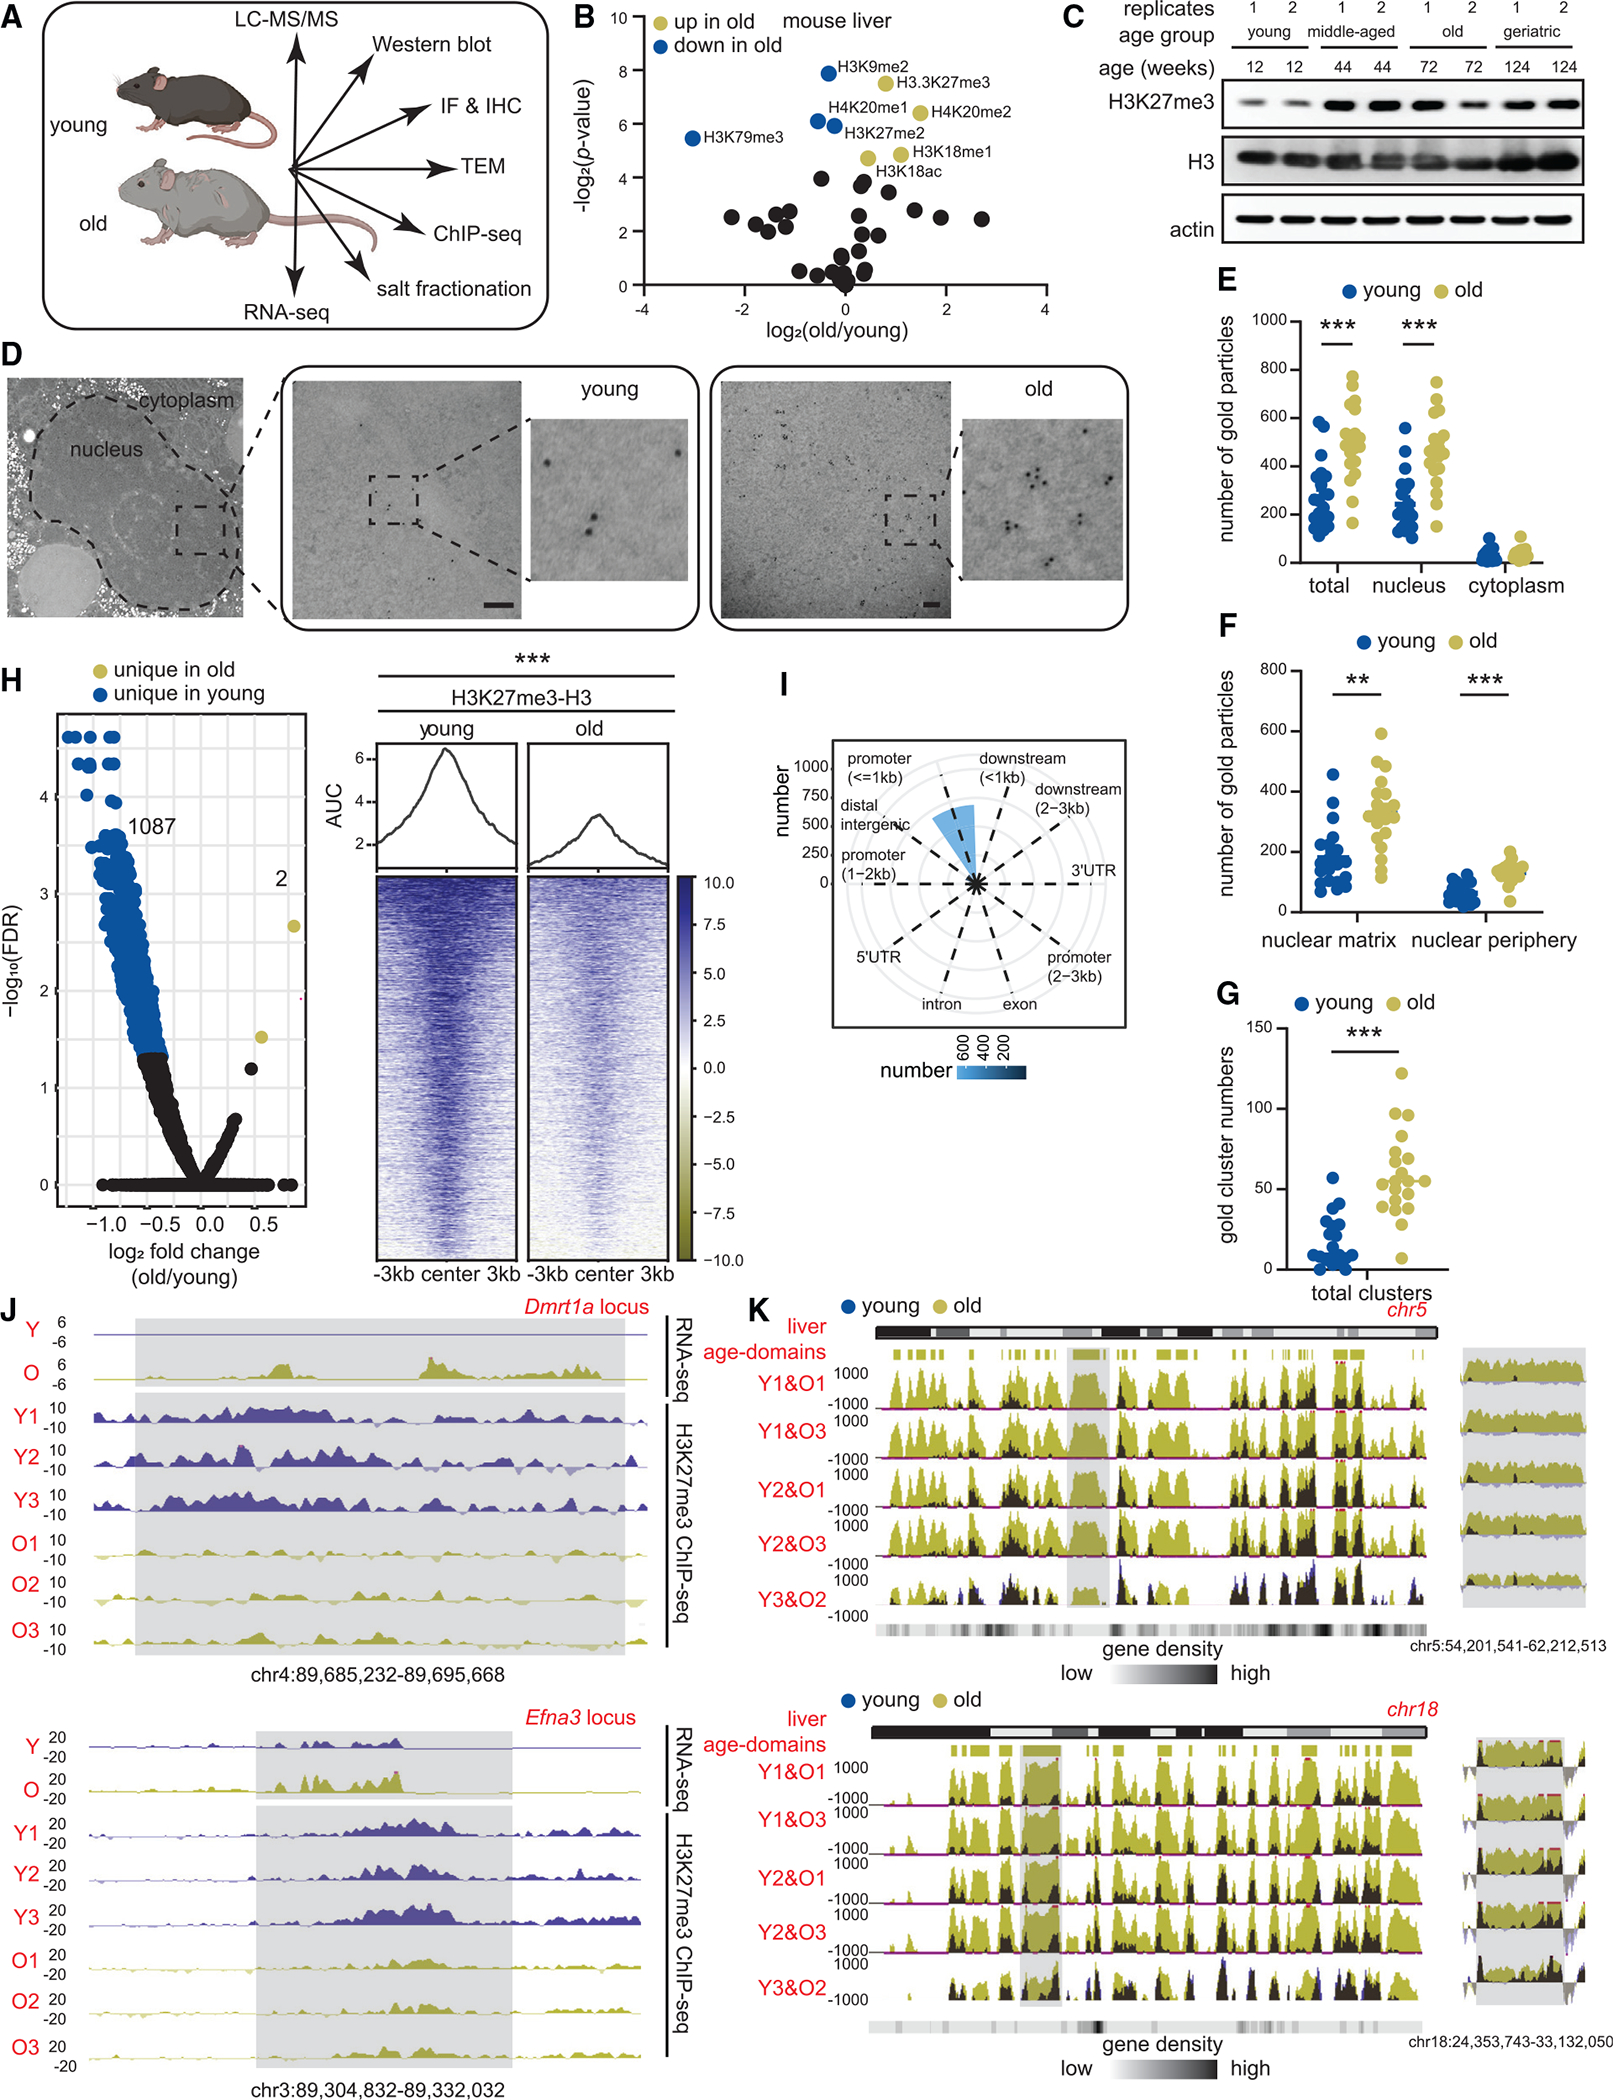
Figure 1. H3K27me3 increases during aging and forms age-domains.

(A) Schematic of chromatin assays performed.
(B) Volcano plot of single hPTMs in old vs. young livers (young 11–12 weeks and old 79–95 weeks, n = 3 biological replicates per group). The significantly increased (green) and decreased (blue) hPTMs are labeled (two-tailed unpaired t test).
(C) Western blot of H3K27me3, H3 and β-actin in liver lysates from mice of indicated ages (young 11–12 weeks, middle-aged 44 weeks, old 79–95 weeks, and geriatric 118 weeks, n = 2 biological replicates per group).
(D) Representative TEM images of young and old hepatocytes with immunogold labeling of H3K27me3 (young 12 weeks and old 91–99 weeks, n = 2 biological replicates per group). Scale bar is 100 nm.
(E–G) (E) Subcellular location, (F) subnuclear location, and (G) cluster (i.e., ≥3) quantification of gold particles. For (E)–(G), data are summarized as mean ± SEM with each dot representing one cell. ** p < 0.01 and *** p < 0.001 from a Kolmogorov-Smirnov test with corrections for multiple comparisons at 1% FDR (two-stage step-up Benjamini, Krieger, and Yekutieli).
(H) Volcano plot (left) and heatmap (right) of DiffBind output (young 10–12 weeks and old 79–95 weeks, n = 3 biological replicates per group). Significantly enriched H3K27me3 peaks in old (FDR < 0.05) are in green and those depleted are in blue.
(I) Annotation of differential peaks identified in (H).
(J) Genome browser snapshots of two differentially enriched peak regions from (H). Gray regions show age-related loss of H3K27me3, and de-repression of genes.
(K) Genome browser snapshot of overlaid H3K27me3 ChIP signal (E. coli spike-in normalized) over chr5 (top) and chr18 (bottom) in sex-matched pairs of young and old mouse livers. Location of age-domains are shown on the top and gene density at the bottom. Gray area is expanded on the right of each chromosome.
