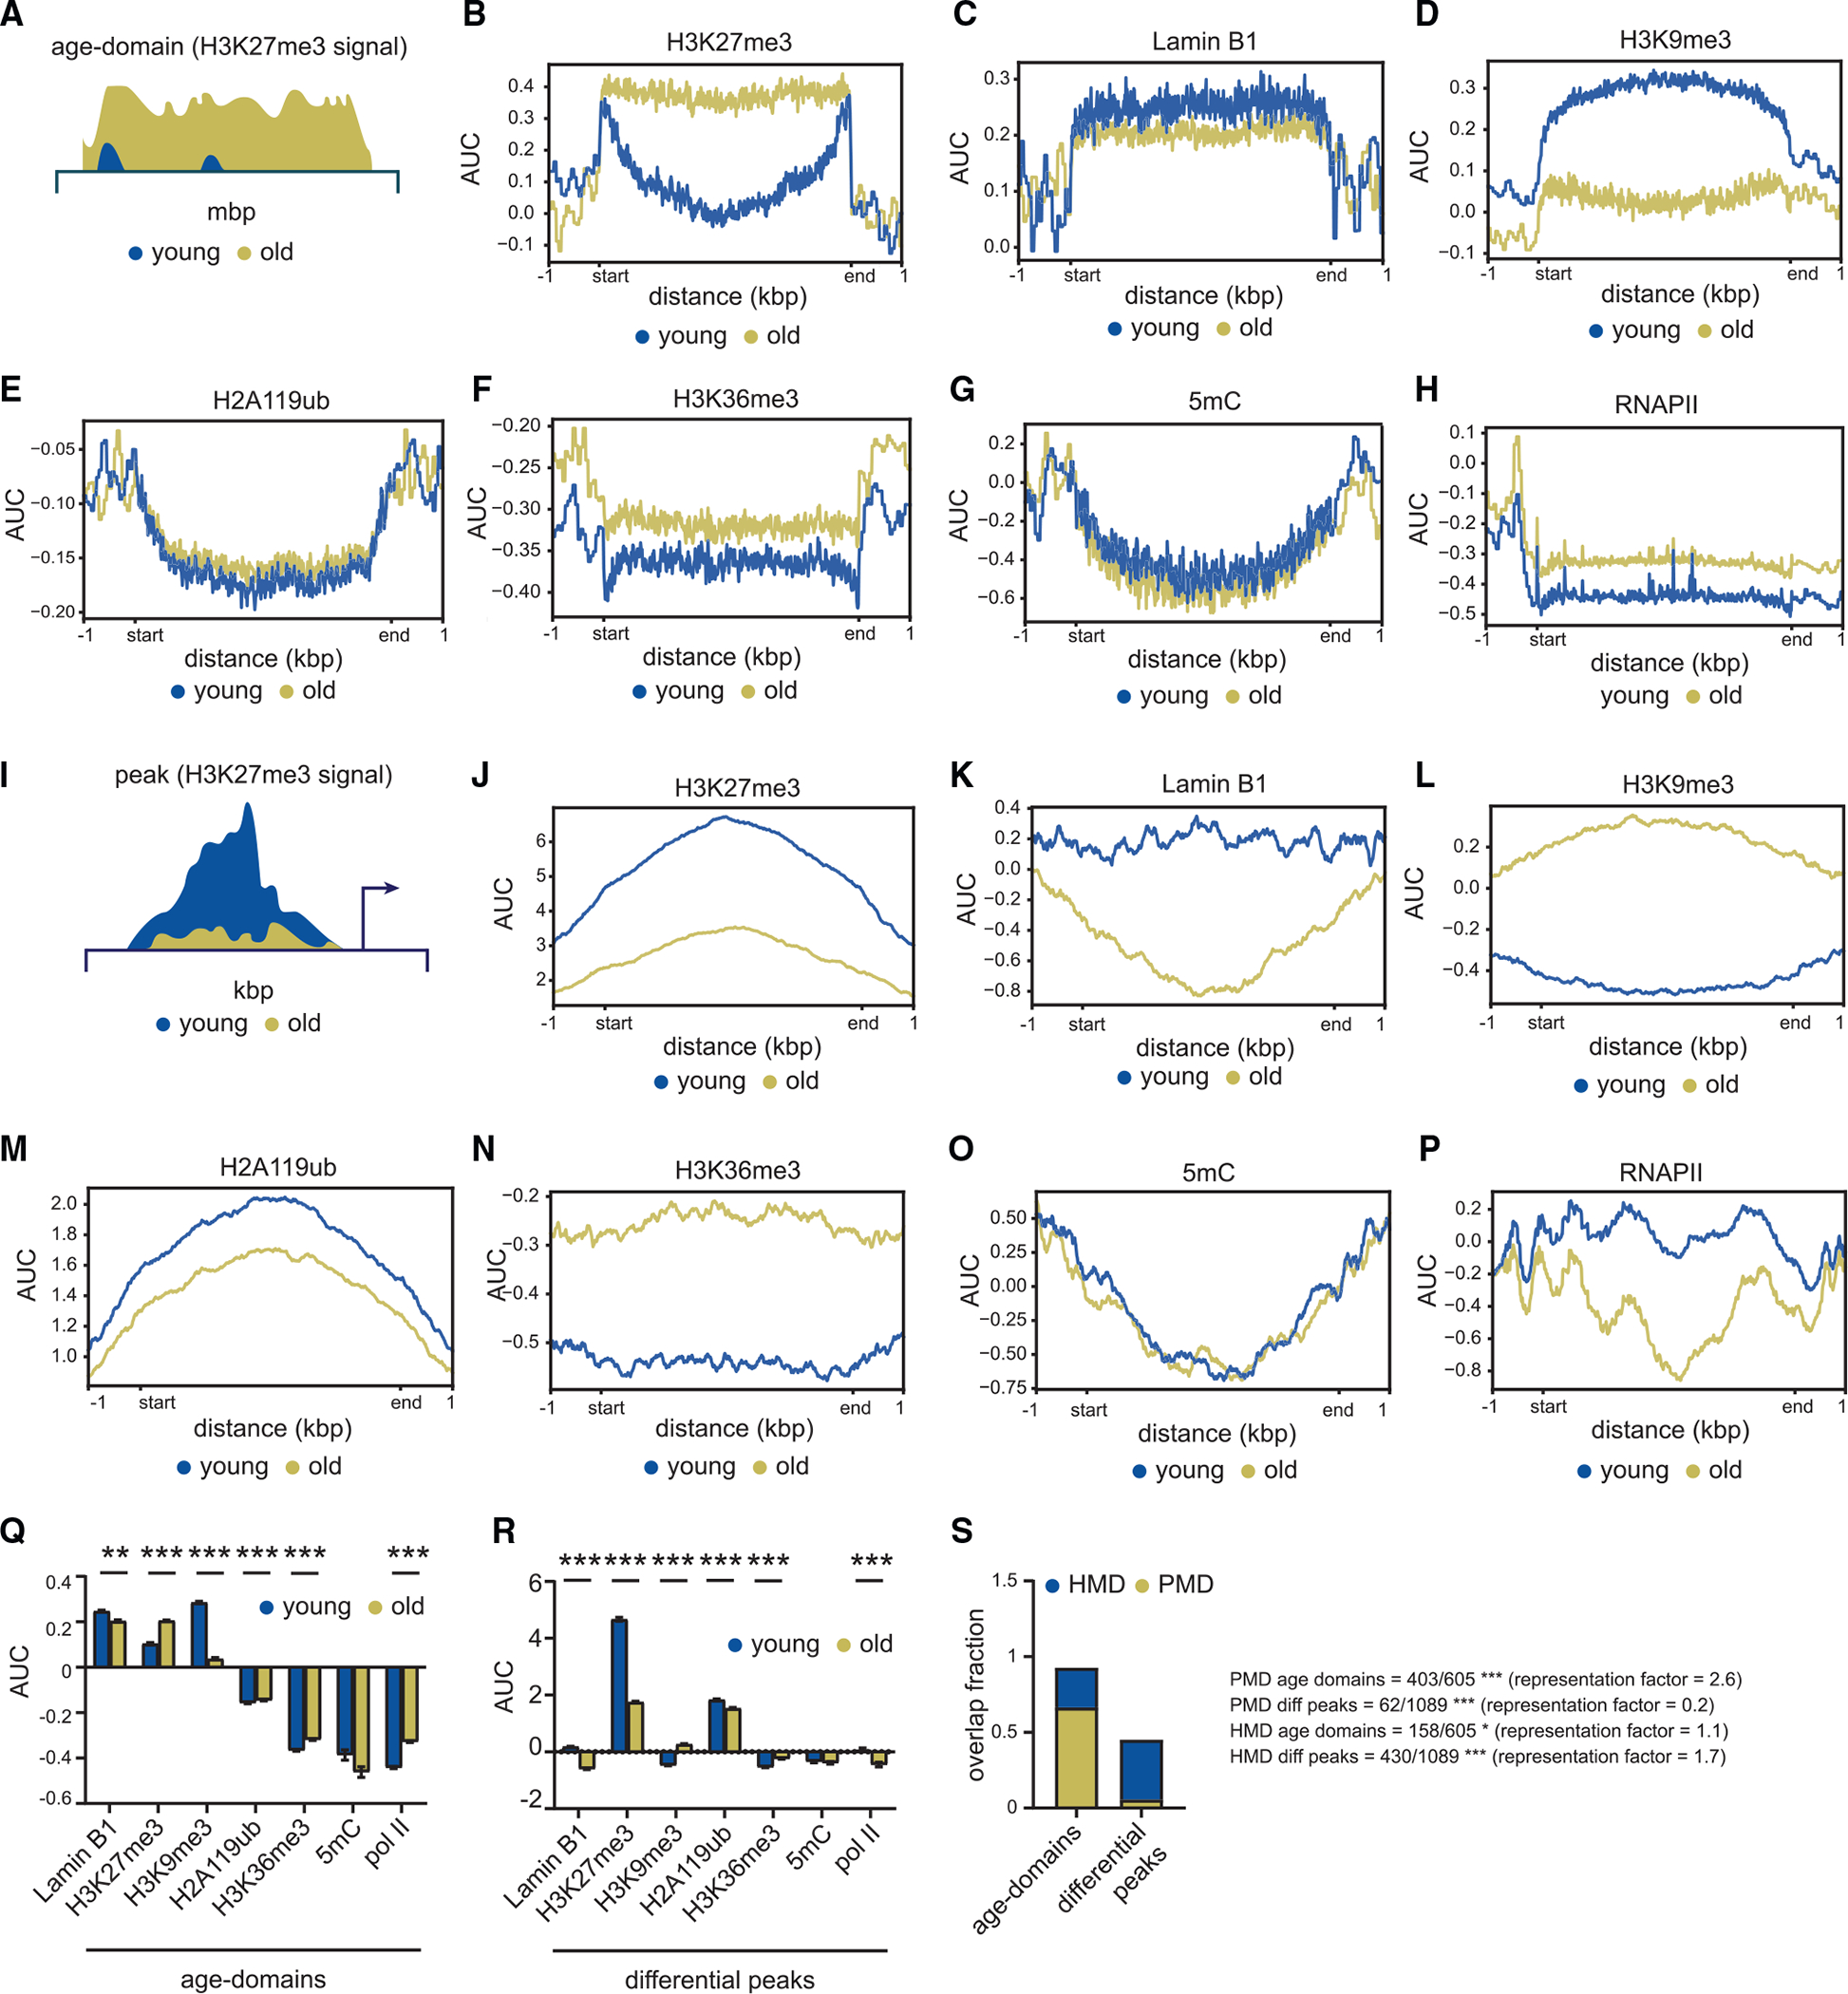
Figure 2. Age-domains lose H3K9me3 and are lamina associated.

(A) Schematic of an age-domain.
(B–H) (B) Metaplot of H3K27me3, (C) lamin B1, (D) H3K9me3, (E) H2A119ub, (F) H3K36me3, (G) 5mC, and (H) RNAPII signal over age-domains specific to old livers.
(I) Schematic of an H3K27me3 peak region.
(J–P) (J) Metaplot of H3K27me3, (K) lamin B1, (L) H3K9me3, (M) H2A119ub, (N) H3K36me3, (O) 5mC, and (P) RNAPII signal over differential peak regions. For (G) and (O), young 12–18 weeks and old 81–90 weeks, n = 4 biological replicates per group. For all other panels except (C) and (K) (published data), young 12–14 weeks and old 80 weeks, n = 4 biological replicates per group.
(Q and R) (Q) Chromatin alterations at age-domains and (R) H3K27me3 differential peaks. For (Q) and (R), data are summarized as mean ± SEM. ** p < 0.01 and *** p < 0.001 from a Welch’s two-tailed unpaired t test.
(S) Stacked bar plots showing overlap of PMDs and HMDs with age-domains and H3K27me3 differential peaks.
* p < 0.05 and *** p < 0.001 from a hypergeometric test.
