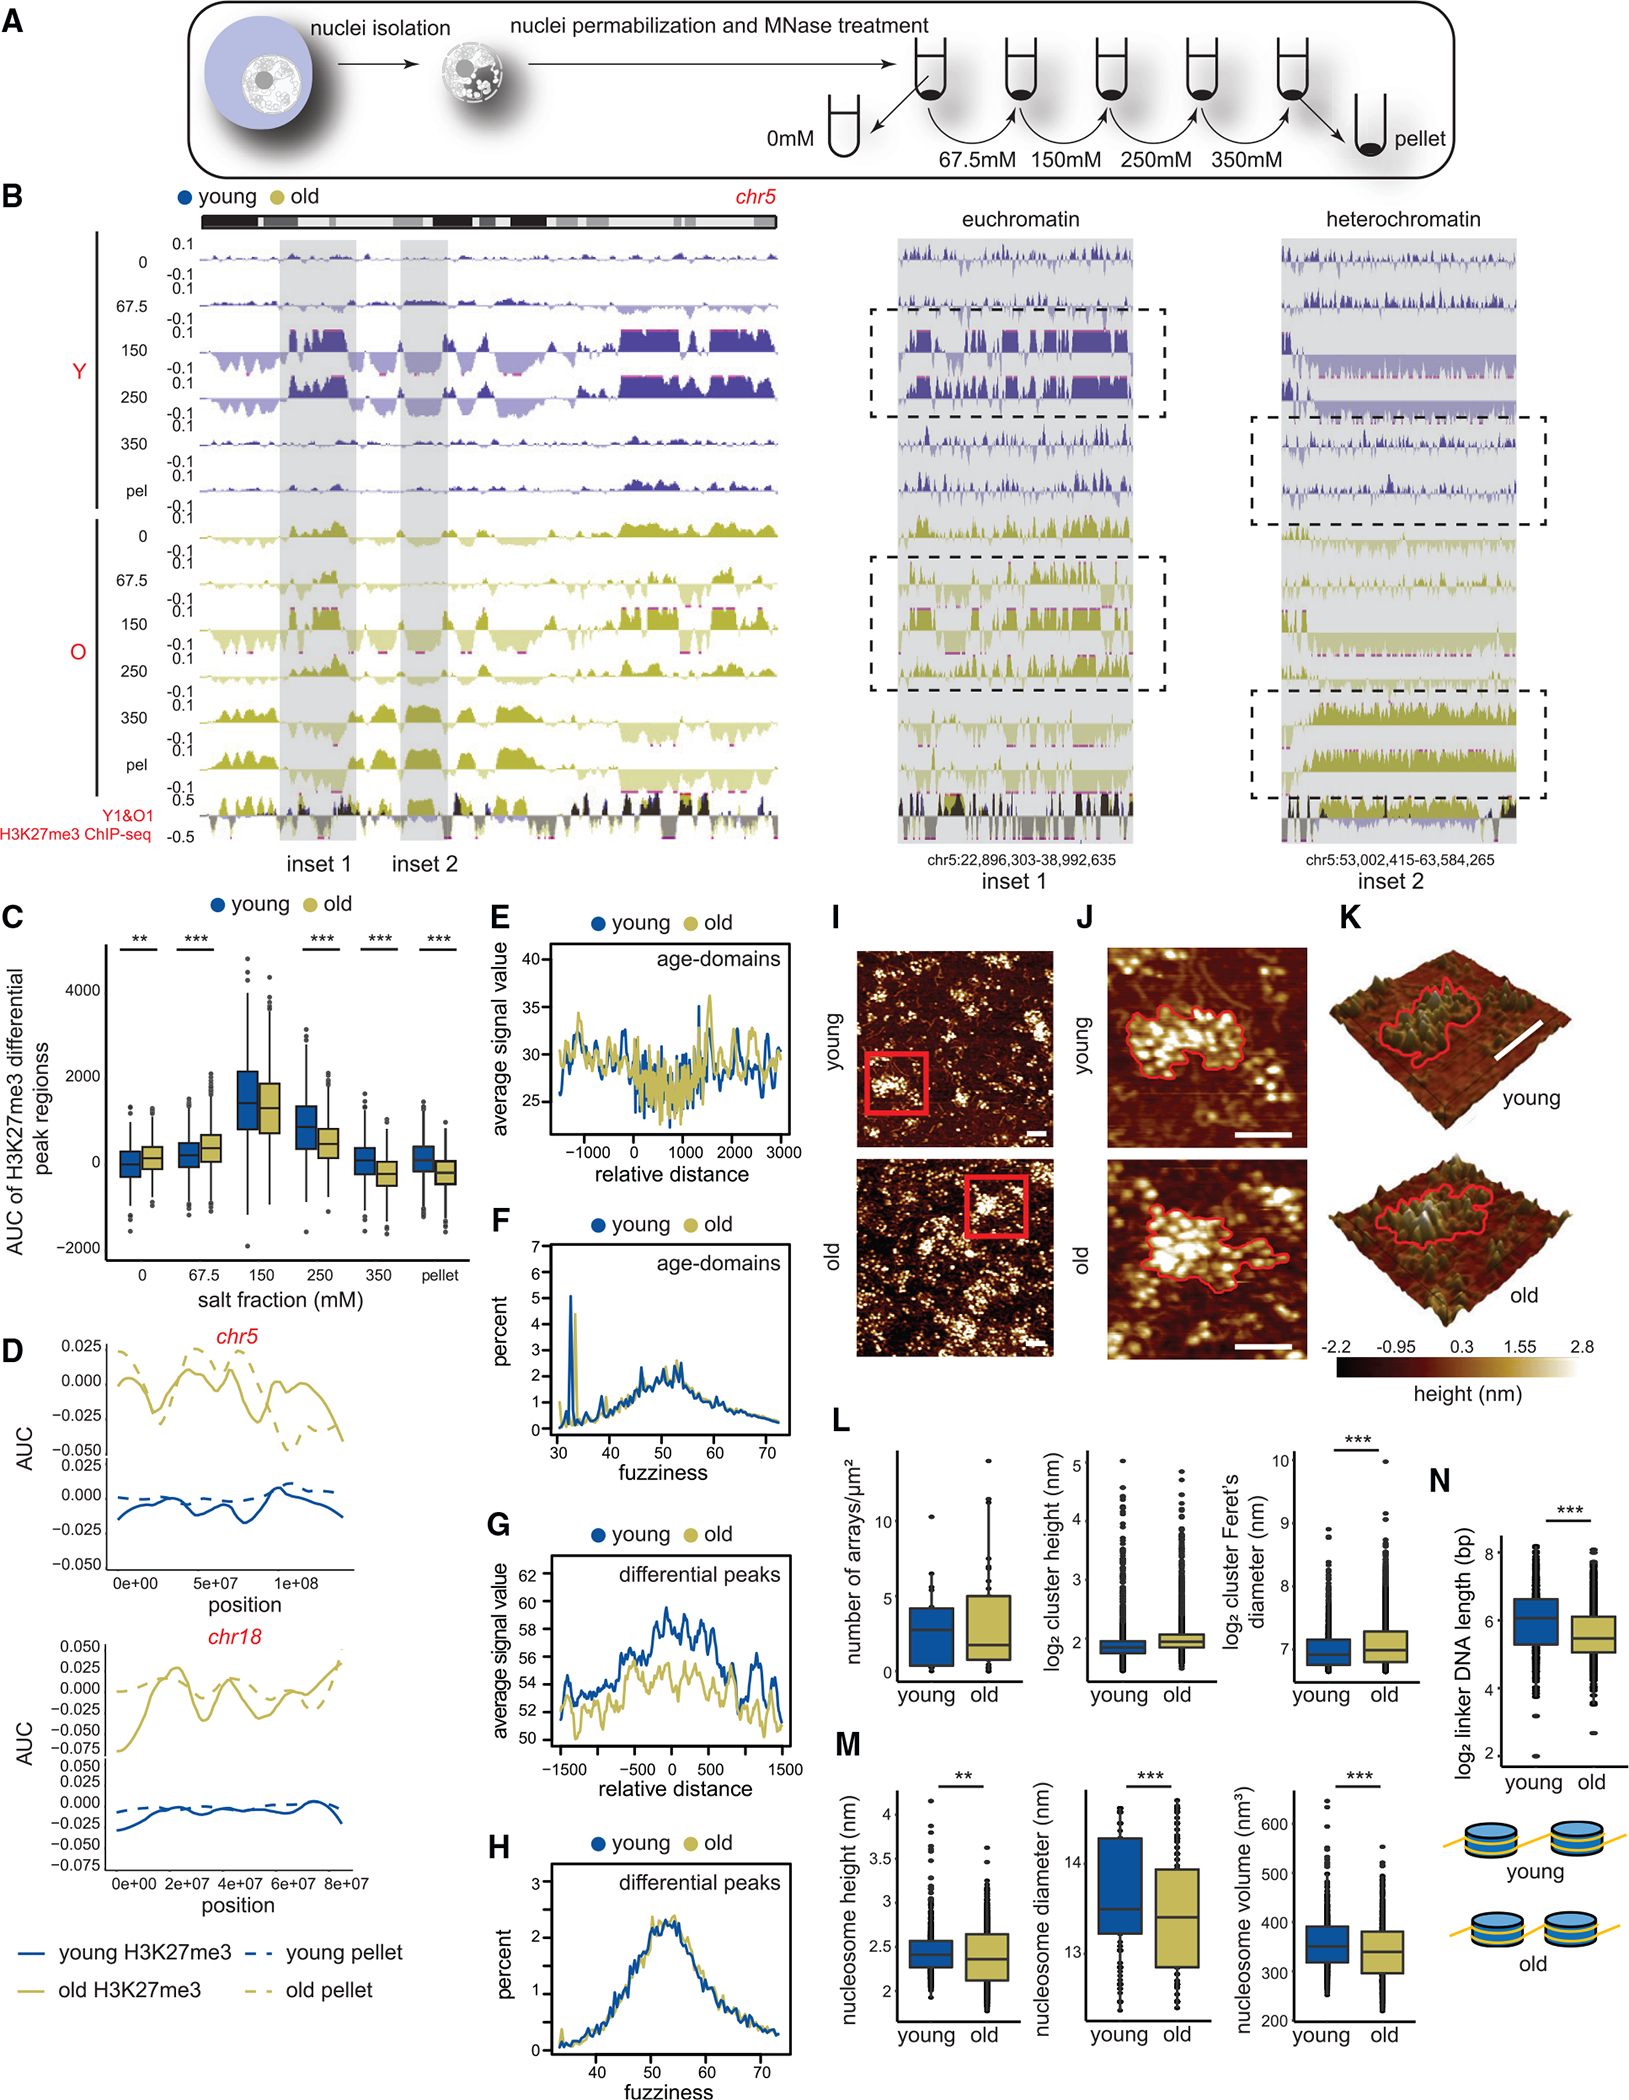
Figure 3. Age-domains are heterochromatinized while H3K27me3 peak regions are euchromatinized during aging.

(A) Schematic of salt fractionation experiment (young 11 weeks and old 81 weeks, n = 2 replicates per group).
(B) Genome browser snapshot of salt fraction enrichments on chr5. Inset 1 is euchromatinized and inset 2 is heterochromatinized with age and expanded on the right.
(C) The salt elution profile of differential peaks in Figure 1H. ** p < 0.01, *** p < 0.001 from a Welch’s two-tailed unpaired t test.
(D) H3K27me3 area under the curve (AUC) (solid line) and salt fraction (dotted line) over chr5 and chr18 depicted as fraction of maximum.
(E and F) (E) Nucleosome occupancy and (F) nucleosome fuzziness score distribution at age-domains.
(G and H) (G) Nucleosome occupancy and (H) nucleosome fuzziness score distribution at differential peaks from Figure 1H.
(I) Representative AFM images of extracted chromatin arrays (young 13–14 weeks and old 78–79 weeks, n = 3 biological replicates per group).
(J) The red boxed region in (I) is magnified. An array in each sample is highlighted with a red contour.
(K) Same as (J) but represented as a 3D image. For (I)–(K), scale bar is 100 nm.
(L and M) (L) Chromatin array number per μm2, cluster height and Feret’s diameter and (M) nucleosomal height, diameter, and volume from young and old livers.
(N) NRL (top) and schematic showing NRL changes in young and old (bottom). ** p < 0.01, *** p < 0.001 from a Welch’s two-tailed unpaired t test. For (C) and (L)–(N), the boxes are bounded by the 25th and 75th percentile values with the median represented as the bar in the middle. The whiskers extend to 1.5× the interquartile length.
