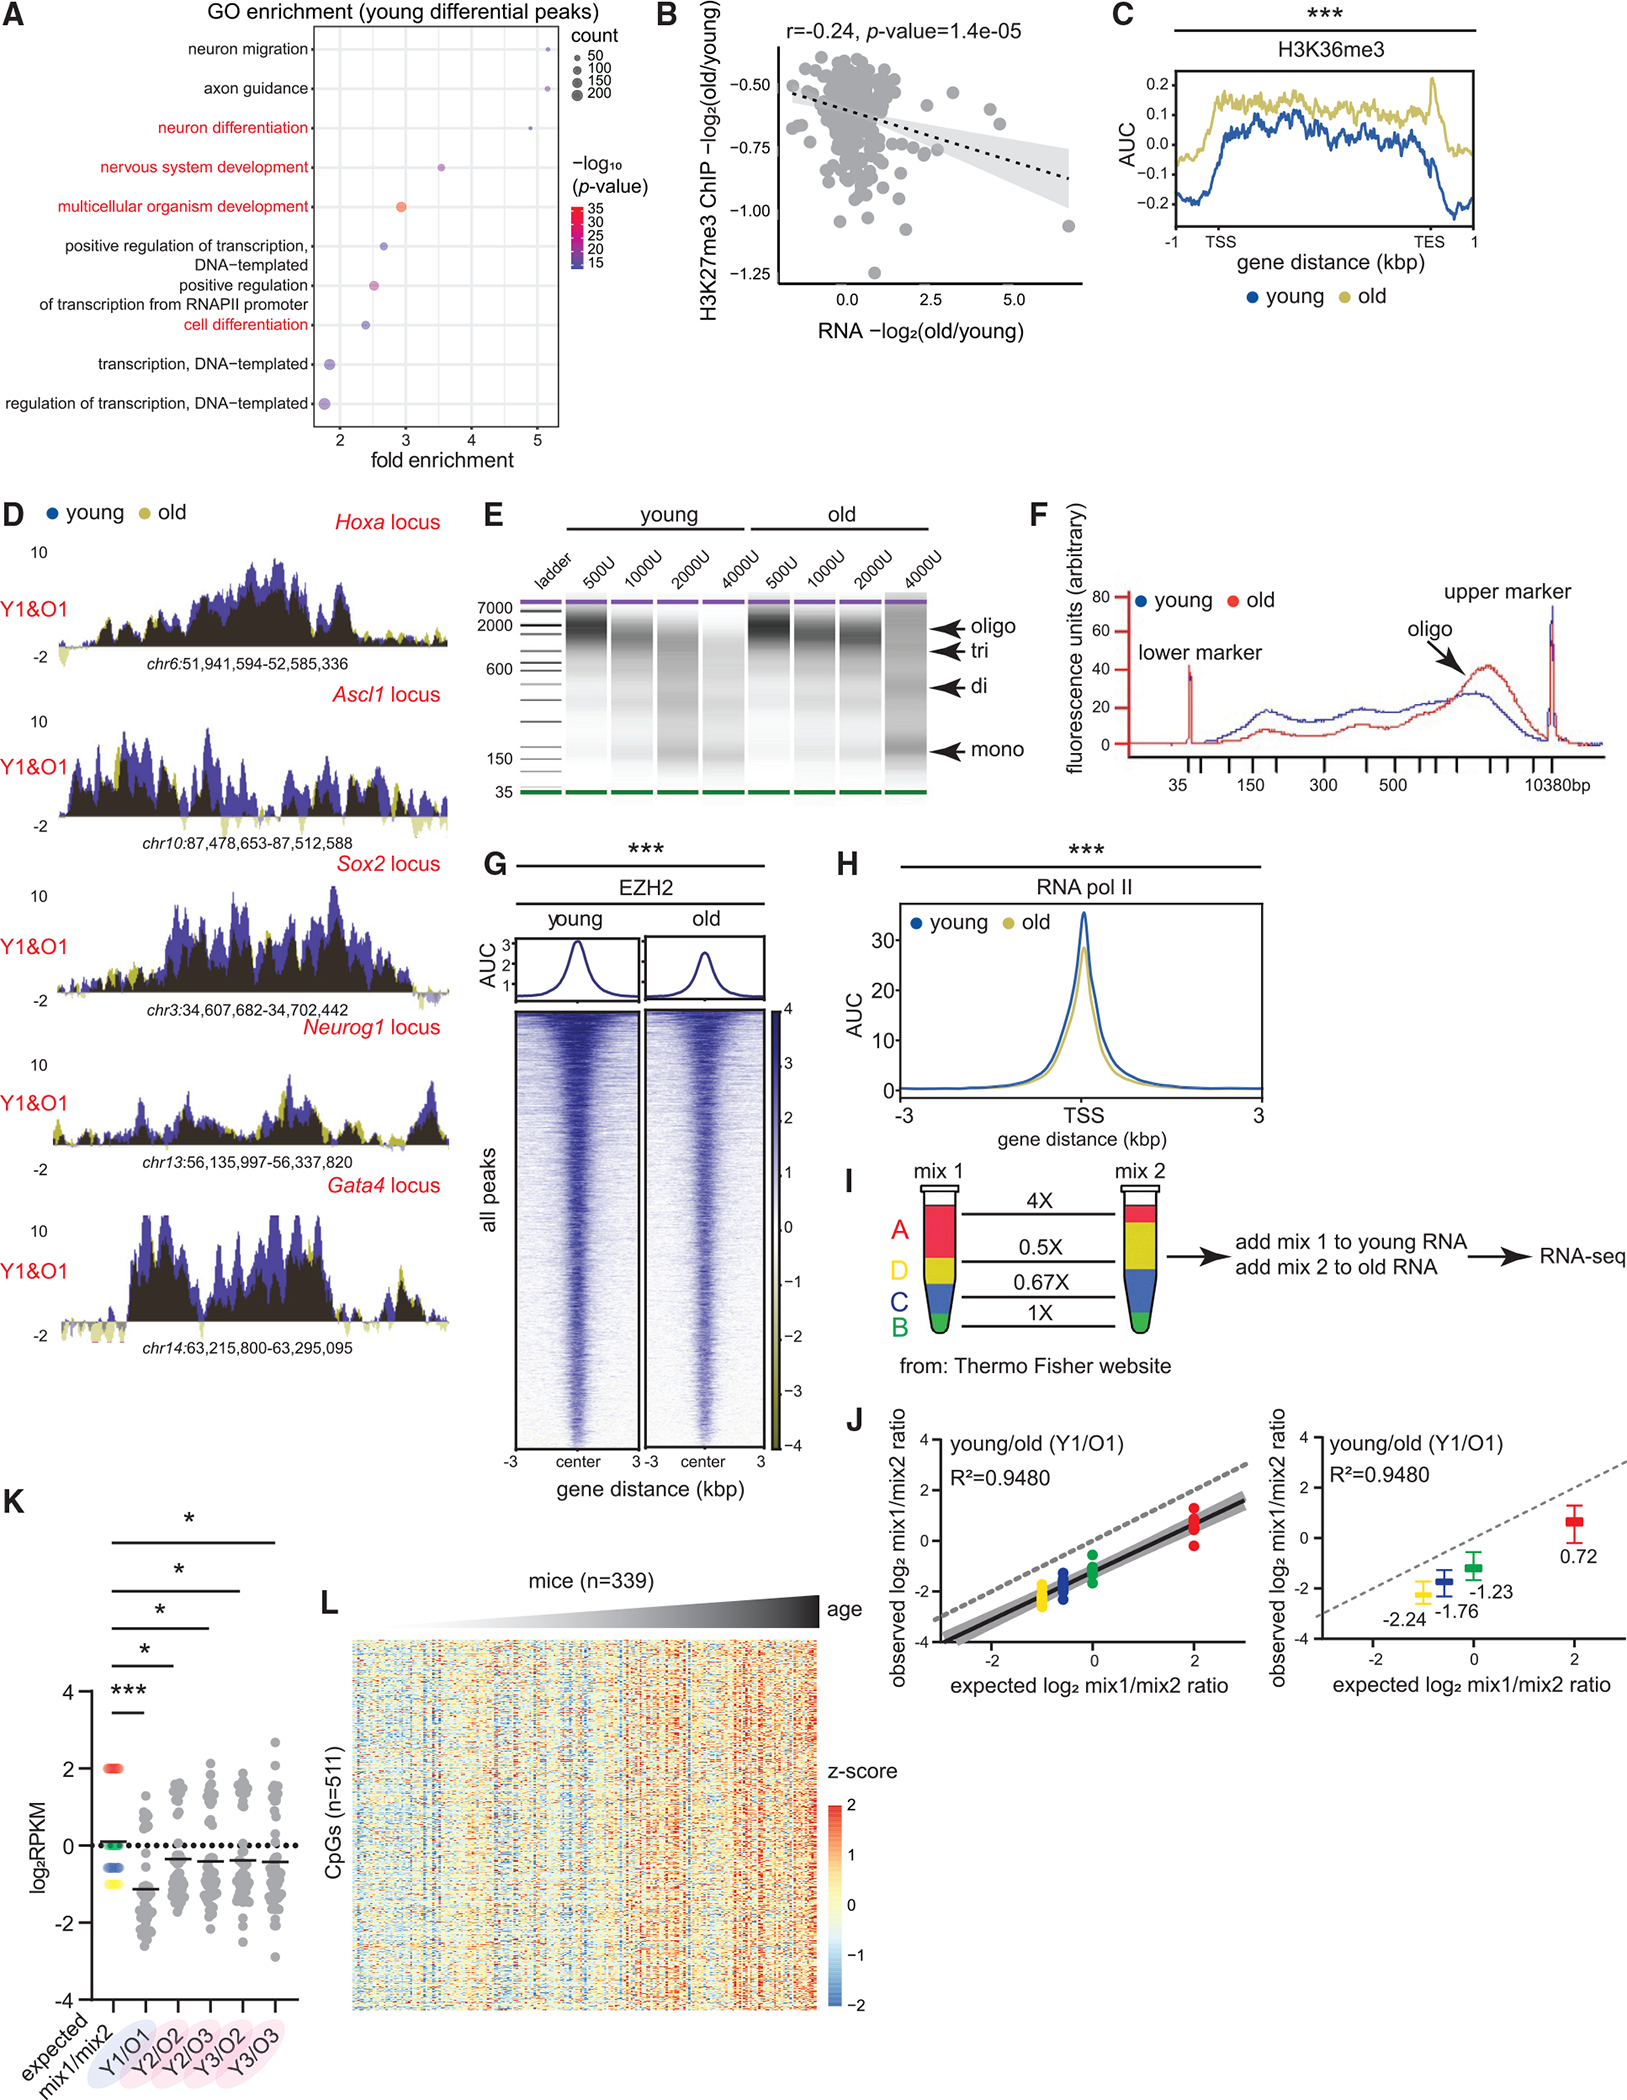
Figure 4. Consequences of H3K27me3 genomic redistribution in aging.

(A) Gene ontology (GO) terms associated with differential peaks in Figure 1H. Development and differentiation genes are in red. p values are from Fisher’s exact test.
(B) Correlation between H3K27me3 and gene expression change in old vs. young. Pearson r and p values are reported.
(C) Metaplot of H3K36me3 signal over gene bodies near differential peaks from Figure 1H (young 12–14 weeks and old 80 weeks, n = 4 biological replicates per group). *** p < 0.001 from a Welch’s two-tailed unpaired t test.
(D) H3K27me3 ChIP-seq profiles at indicated loci in young and old livers.
(E) BioAnalyzer profiles of MNase digest from young and old livers.
(F) The overlaid digestion profile with 2,000 U of MNase.
(G) Heatmap showing EZH2 signal at all called peaks in young and old livers (young 11 weeks and old 80 weeks, n = 4 biological replicates per group).
(H) Metaplot of RNAPII signal (young 12–14 weeks and old 80 weeks, n = 4 biological replicates per group) at all annotated TSSs. For (G)–(H), *** p < 0.001 from a Welch’s two-tailed unpaired t test.
(I) ERCC Exfold transcript abundance and RNA-seq spike-in strategy (young 10–12 weeks and old 79–95 weeks, n = 3 biological replicates per time point). (A)–(D) represent the 4 groups of transcripts present in mix 1 and 2.
(J) Observed vs. expected plot of mix1/mix2 log ratio for one pair of sex-matched young and old animals before resection. The dotted line represents a hypothetical experiment where the observed mix1/mix2 ratio is the same as expected. On the right, same data shown as boxplots with median values indicated. The boxes are bounded by the 25th and 75th percentile values with the median represented as the bar in the middle. The whiskers extend to 1.5× the interquartile length.
(K) Expected and observed mix1/mix2 ratios plotted for all animals. *p < 0.05 and *** p < 0.001 from a one-way ANOVA with corrections for multiple comparisons (FDR method of Benjamini and Hochberg).
(L) Liver DNA methylation signal plotted across different ages from Mozhui et al.30
