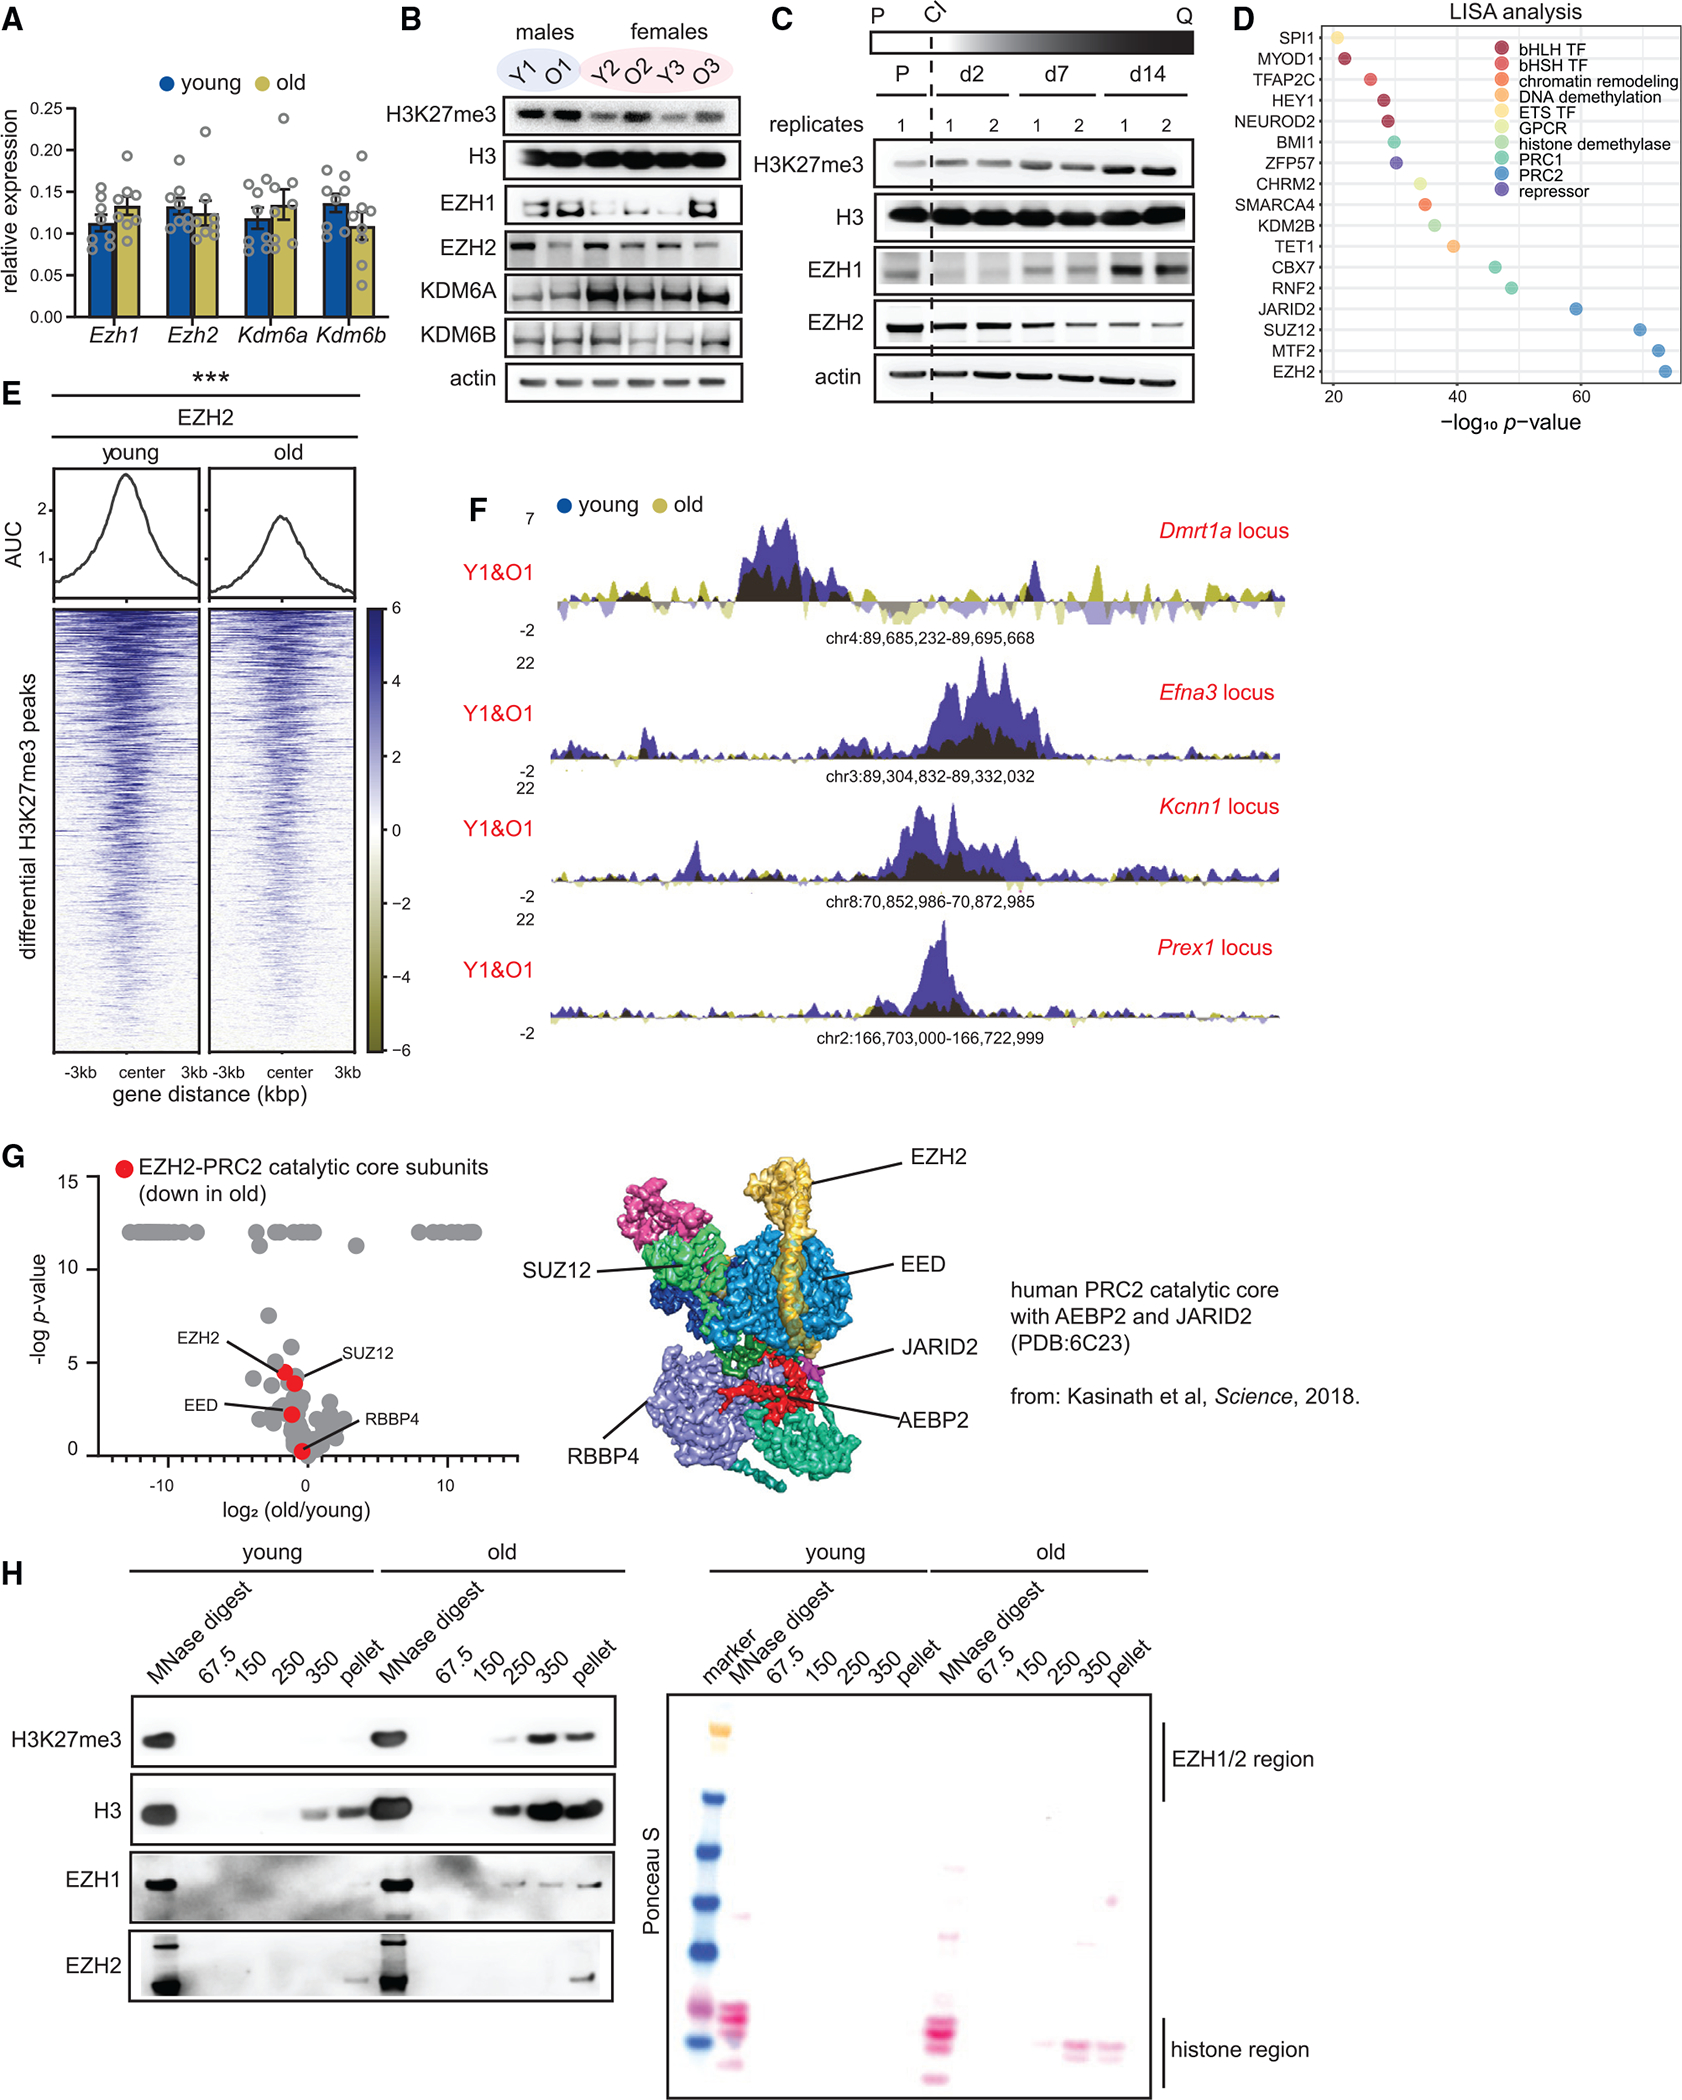
Figure 5. H3K27me3 patterns in aging are mimicked by deep quiescence cultures (hyper-quiescence).

(A) Reverse-transcriptase quantitative PCR (RT-qPCR) analysis of Ezh1, Ezh2, Kdm6a, and Kdm6b mRNA levels in young and old livers. Data are summarized as mean ± SEM (young 12 weeks and old 80 weeks, n = 8 biological replicates per group). A Welch’s two-tailed unpaired t test did not yield any significant results.
(B) Western blot of H3K27me3, H3, EZH1, EZH2, KDM6A, and KDM6B protein levels in young and old livers (young 11–12 weeks and old 79–95 weeks, n = 3 biological replicates per group).
(C) Western blot of H3K27me3, H3, EZH1, and EZH2 in proliferating and quiescent cells over 14 days. Quiescence was induced by contact inhibition (n = 2 biological replicates per group). P is proliferating, Q is quiescence, and CI is contact inhibition.
(D) LISA analysis of H3K27me3 differential peak regions from Figure 1H. p value is calculated using the Wilcoxon rank test comparison of the query and background.
(E) Heatmap showing EZH2 signal at differential peaks from Figure 1H (young 11 weeks and old 80 weeks, n = 4 biological replicates per group). *** p < 0.001 from a Welch’s two-tailed unpaired t test.
(F) Genome browser snapshots of EZH2 enrichment over 4 peak regions from (E).
(G) Volcano plot of EZH2 interactors in old vs. young livers (young 20 weeks and old 86 weeks, n = 4 biological replicates per group). The PRC2 catalytic core subunits are in red. p values are from a two-tailed unpaired t test. The published cryo-EM structure of the PRC2 catalytic core (with AEBP2 and JARID2) is shown on the right.
(H) Western blot of H3K27me3, H3, EZH1, and EZH2 from different salt fractions of chromatin from Figure 3B in young and old livers, Ponceau S-stained membrane on the right.
