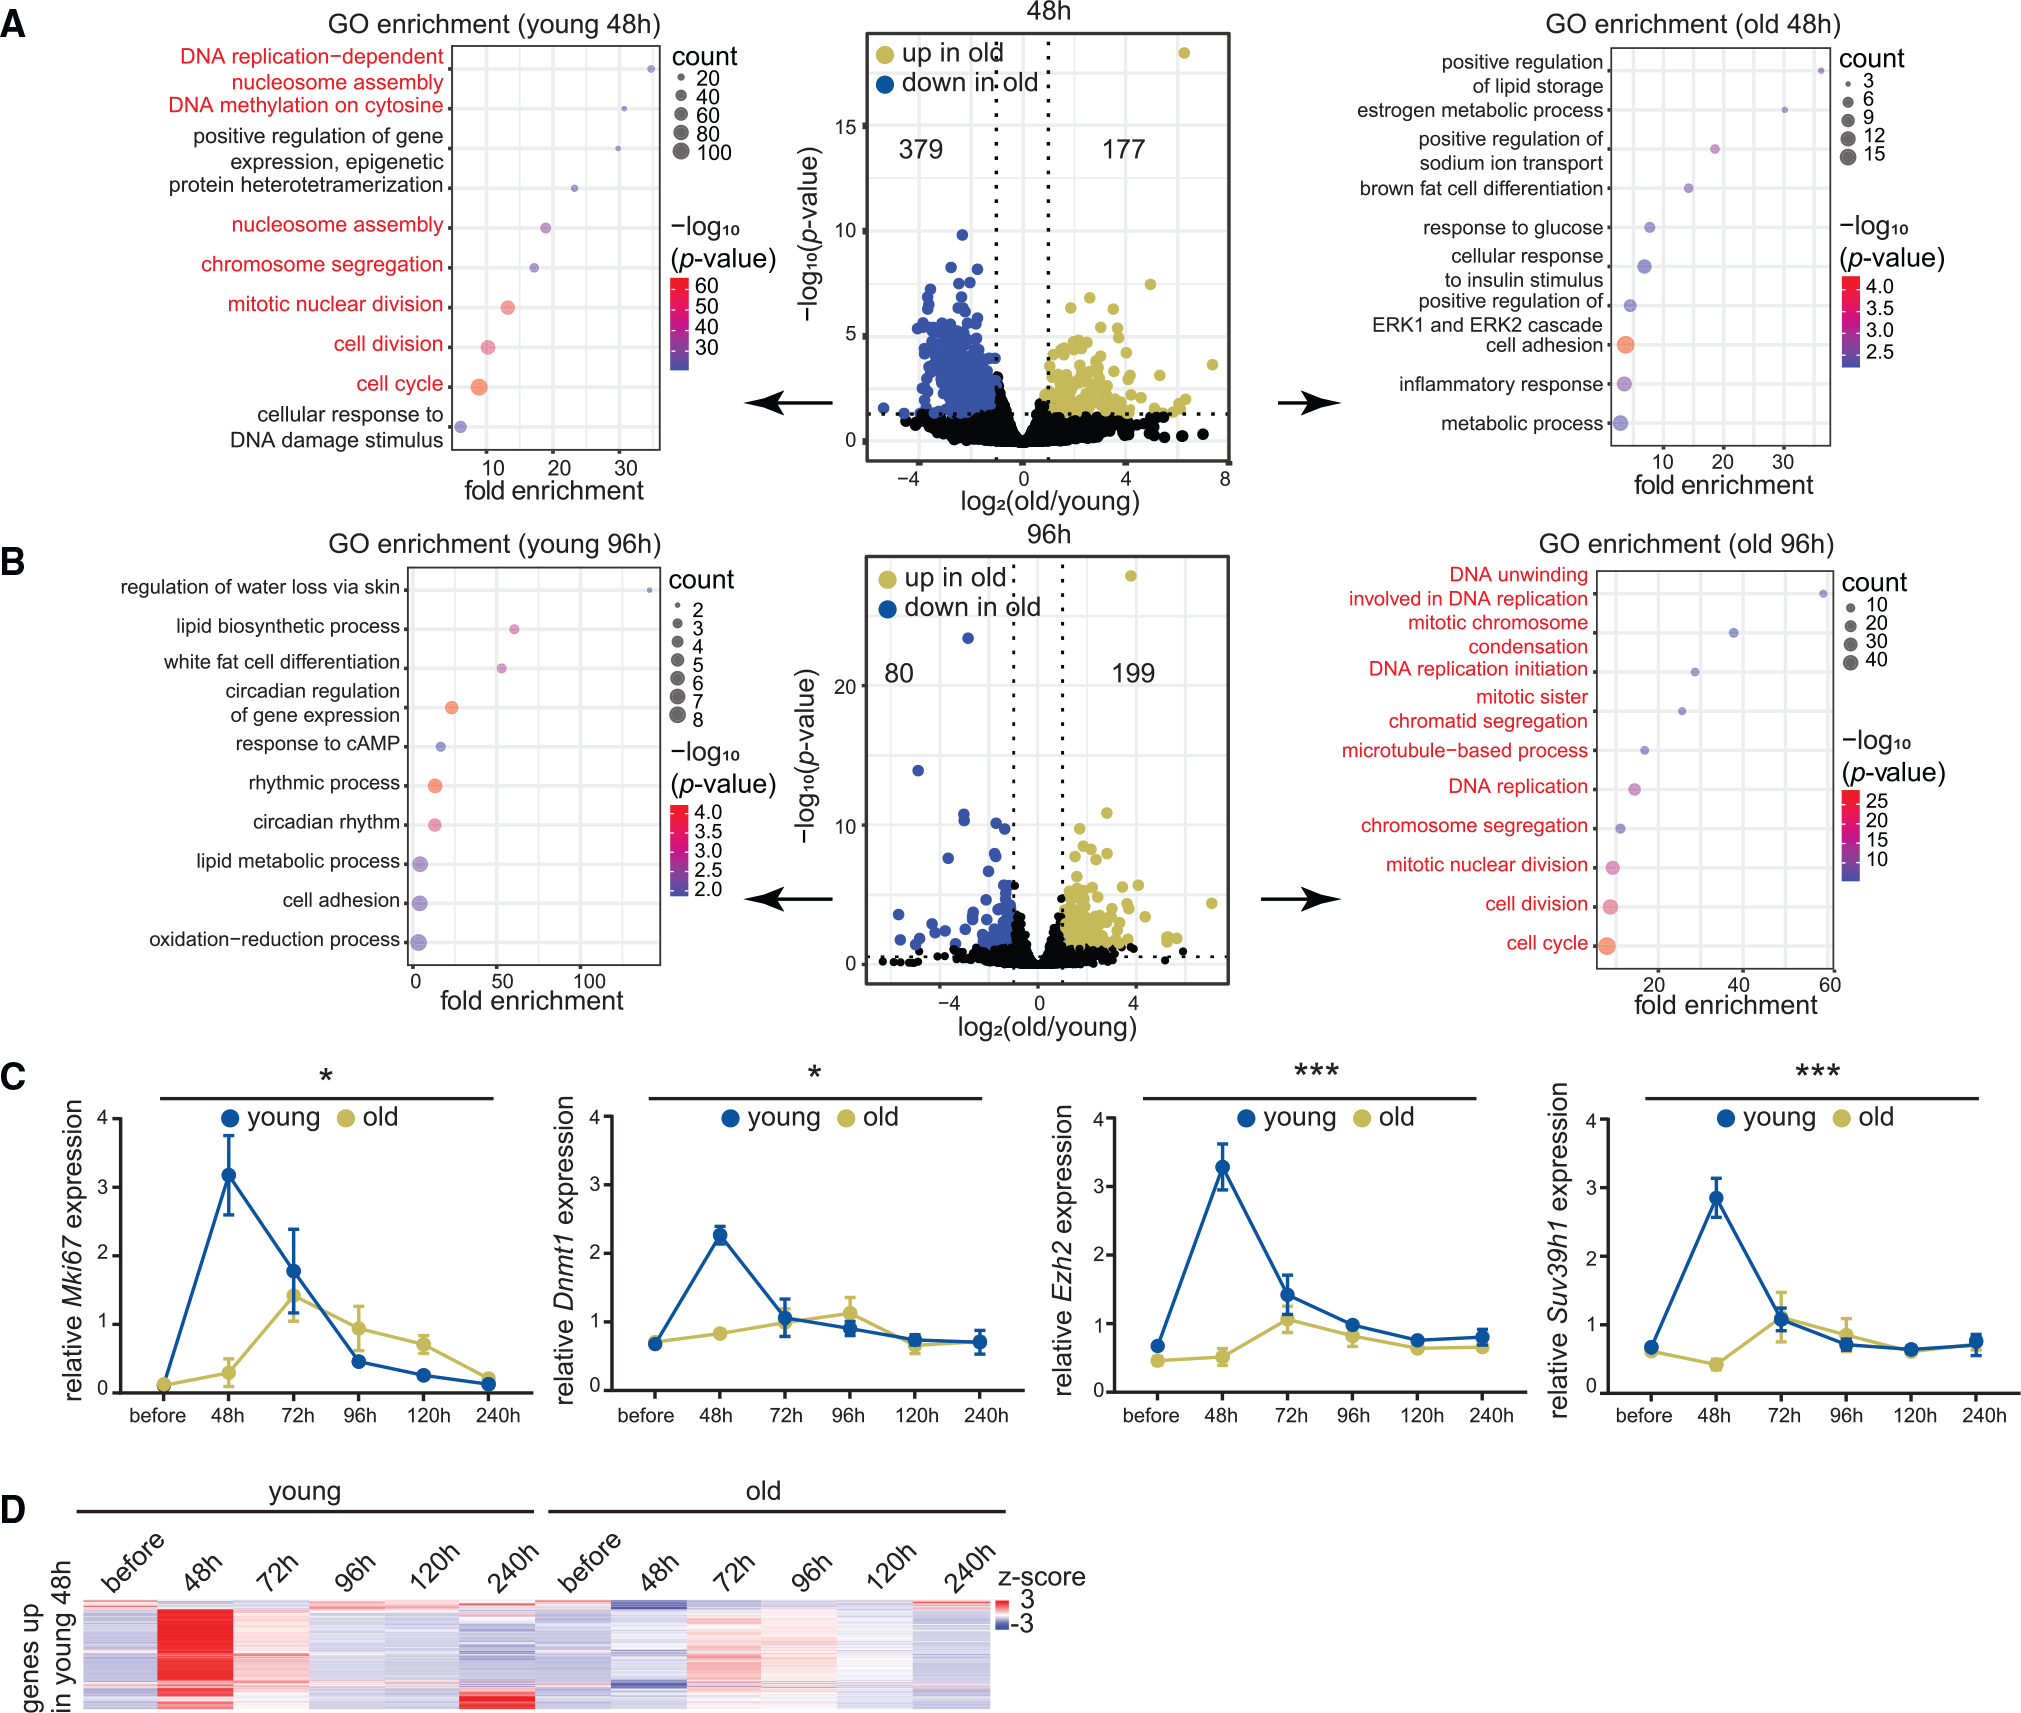
Figure 6. Transcriptomic signatures of aging and regeneration.

(A) Volcano plot of differentially expressed mRNAs 48 h post-resection in young and old livers (young 10–15 weeks and old 79–83 weeks, n = 3 biological replicates per time point). mRNAs significantly upregulated (p < 0.05 from Benjamini-Hochberg procedure) in old are in green and those downregulated are in blue. Biological process GO terms are indicated for genes downregulated (left) or upregulated (right) in the old. Cell proliferation genes are in red. p values are from Fisher’s exact test.
(B) Same as (A) except samples are 96 h post-resection (young 10–12 weeks and old 79–83 weeks, n = 3 biological replicates per time point).
(C) RT-qPCR analysis of Mki67, Dnmt1, Ezh2, and Suv39h1 expression relative to Actb across the regeneration time course (young 10–16 weeks and old 79–98 weeks, n = 3 biological replicates per time point). Data are summarized as mean ± SEM (n = 3 biological replicates per group per time point). * p < 0.05 and *** p < 0.001 from a two-way ANOVA with Tukey’s multiple comparisons test.
(D) Heatmap of cell proliferation gene counts across the regeneration time course.
