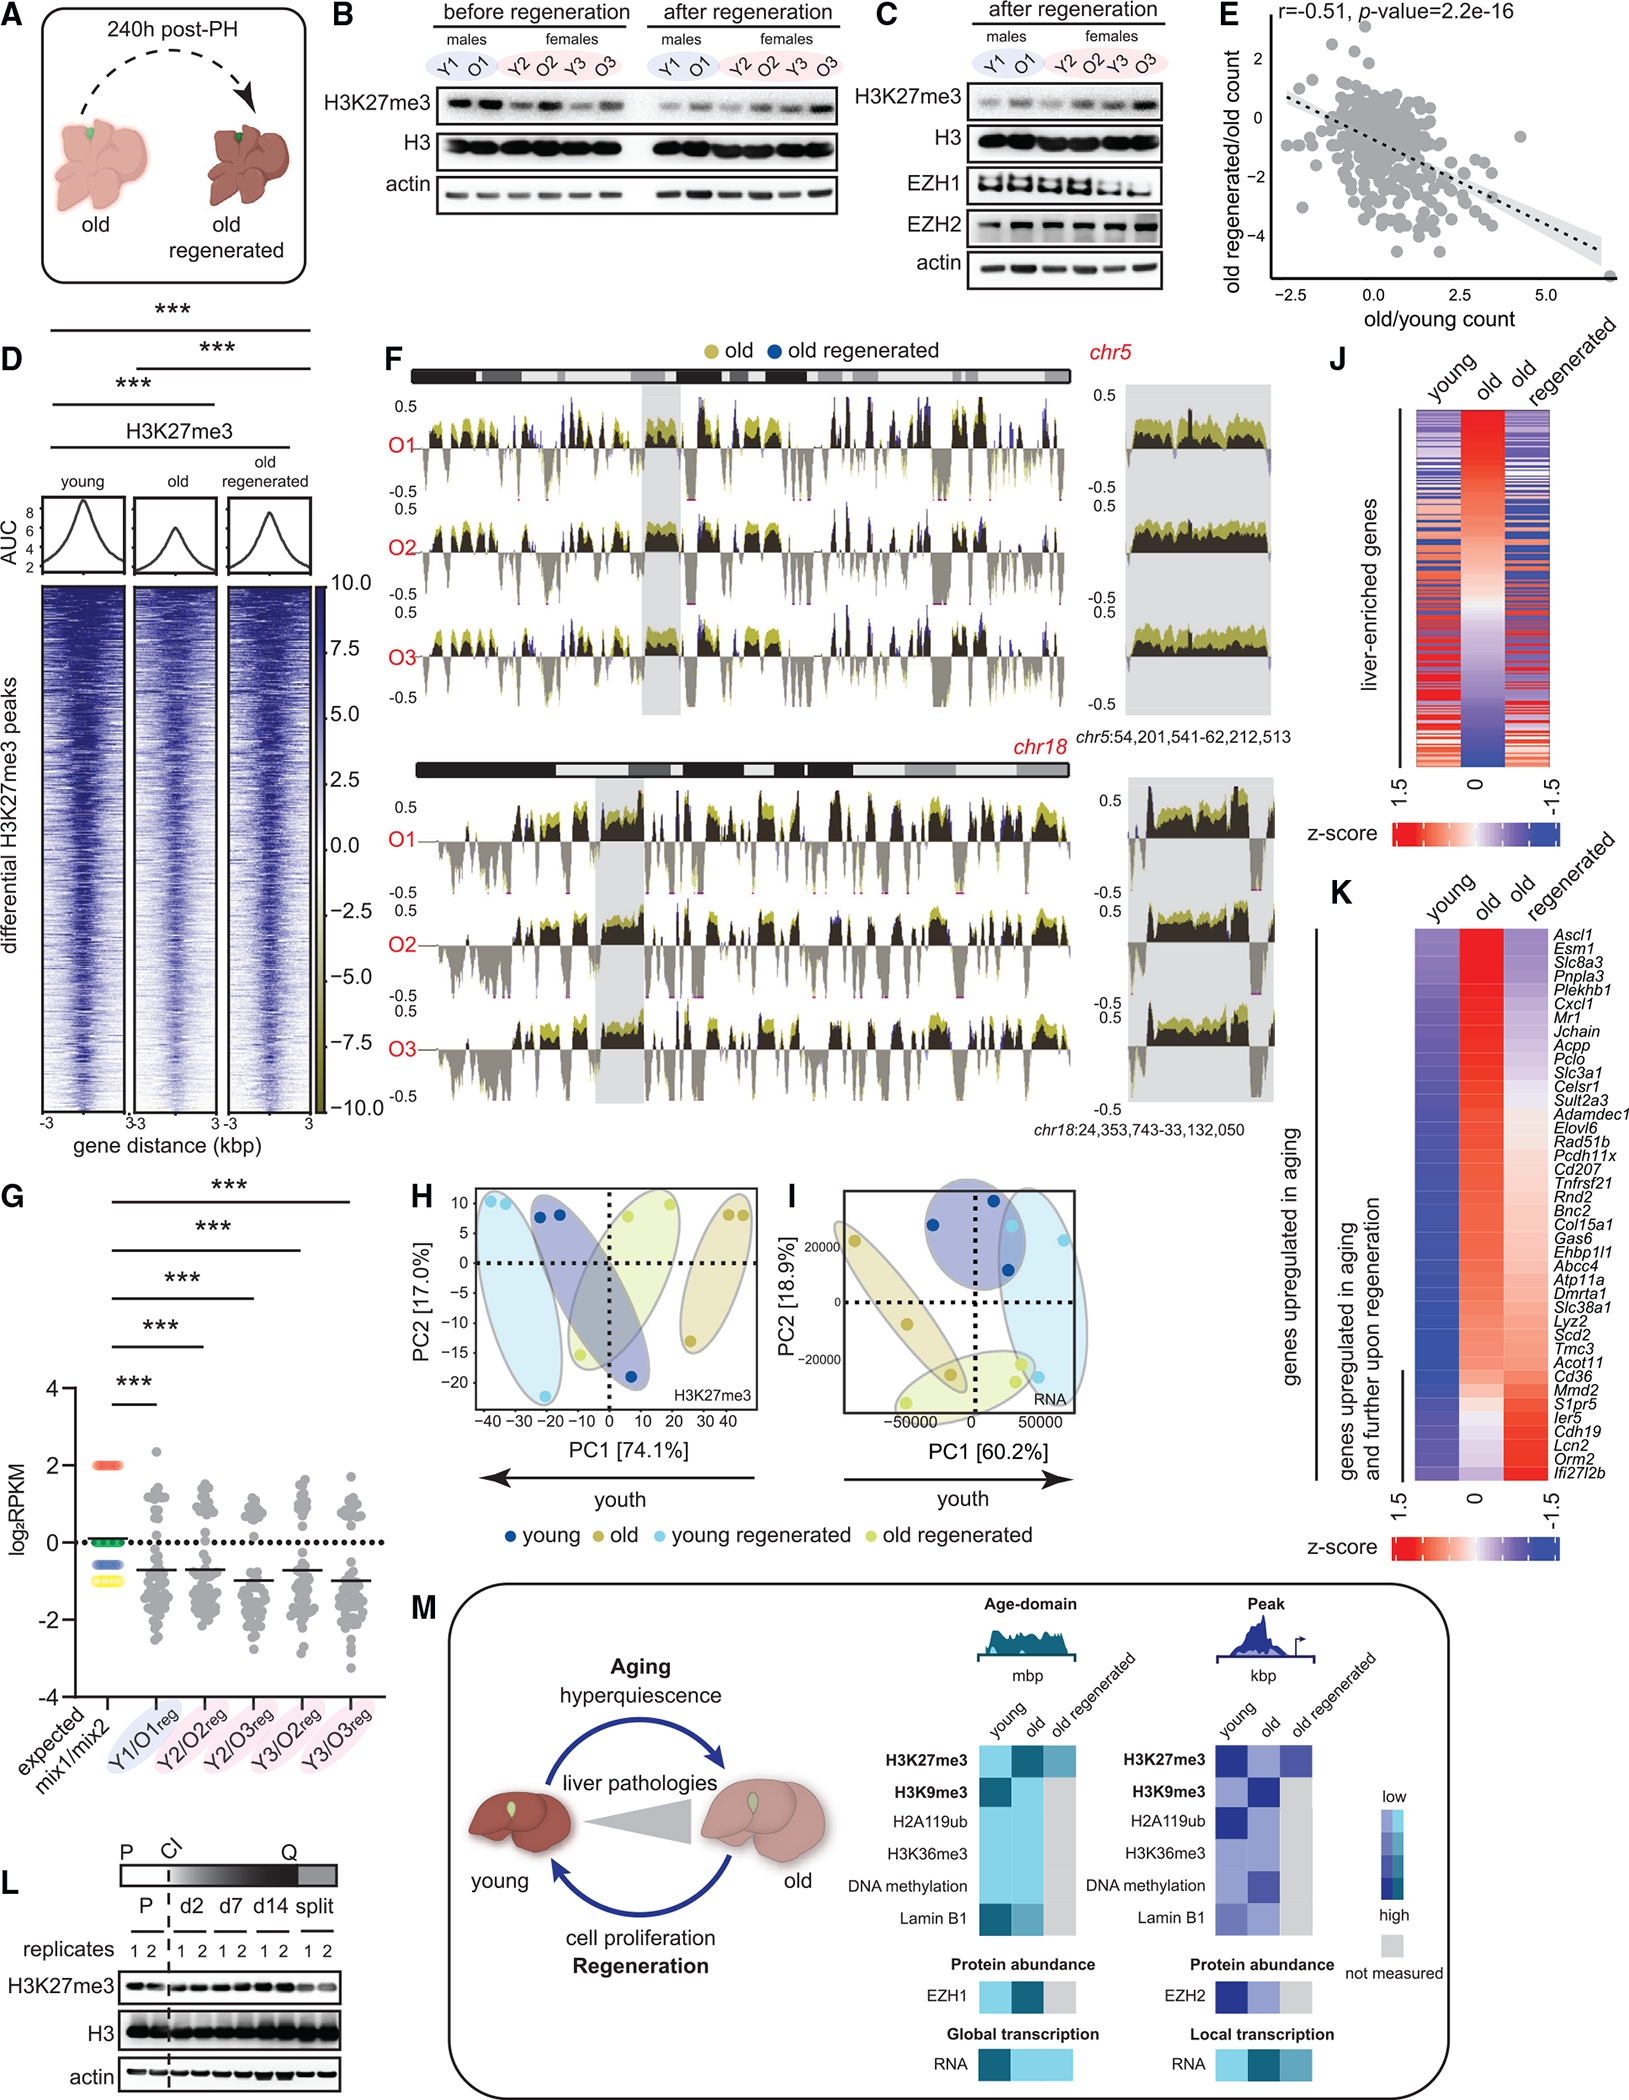
Figure 7. Liver regeneration dilutes H3K27me3 and rejuvenates old tissue.

(A) Schematic of complete liver regeneration.
(B) Western blot of H3K27me3, H3, and β-actin showing replication dilution of H3K27me3 post-regeneration. The “before regeneration” H3K27me3 blot is same as in Figure 5B.
(C) Western blot of H3K27me3, H3, EZH1, EZH2, and β-actin post-regeneration. The “after regeneration” H3K27me3, H3, and actin blots are same as in (B).
(D) Heatmap of H3K27me3 signal at differential peaks from Figure 1H before and after regeneration. *** p < 0.001 from a Welch’s two-tailed unpaired t test.
(E) Correlation of gene expression between old vs. young and old regenerated vs. old. The gene set corresponds to common genes that were de-repressed in aging and re-repressed post-regeneration. Pearson r and p values are reported.
(F) Genome browser snapshot of overlaid H3K27me3 signal over chr5 (top) and chr18 (bottom) before and after regeneration. Gray area is expanded on the right.
(G) Expected and observed mix1/mix2 ratios plotted for all animals. *** p < 0.001 from a one-way ANOVA with corrections for multiple comparisons (FDR method of Benjamini and Hochberg).
(H) PCA plot of H3 subtracted H3K27me3 genome coverage from young, young regenerated, old, and old regenerated livers.
(I) Same as (H) except PCA is from RNA-seq data.
(J) Heatmap of liver-enriched gene counts in young, old, and old regenerated livers sorted on the old sample.
(K) Heatmap of age-upregulated (from Figure S5D) gene counts in young, old, and old regenerated livers sorted on the old sample. For (B)–(J), young 11–12 weeks and old 79–95 weeks, n = 3 biological replicates per group.
(L) Western blot of H3K27me3, H3, and β-actin from HepG2 lysates prepared from cells establishing and exiting quiescence. P is proliferating, Q is quiescence, and CI is contact inhibition.
(M) Overview of H3K27me3 changes in aging and regeneration.
