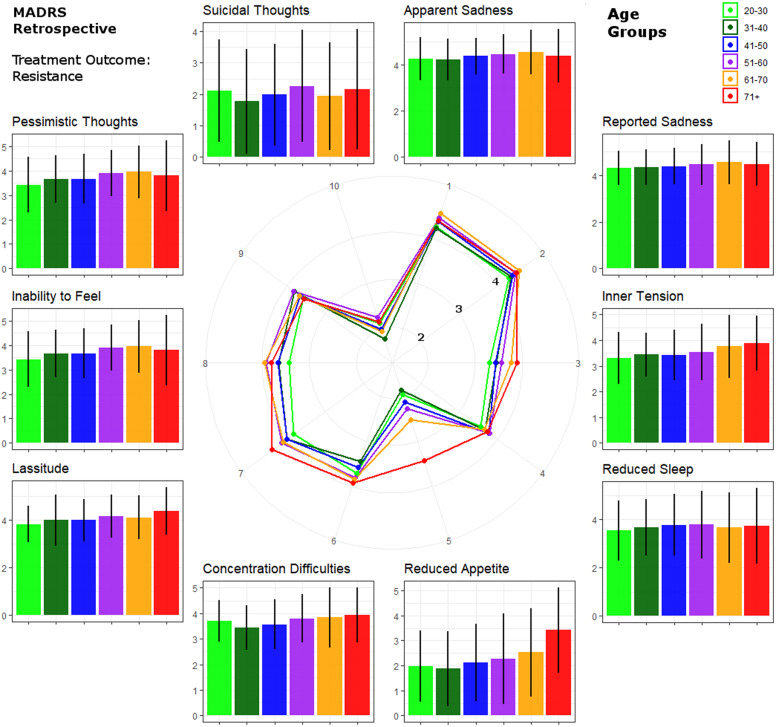
Figure 2.
Circular plot of average baseline severity scores of each Montgomery–Åsberg Depression Rating Scale (retrospective MADRS) item within patients with treatment-resistant depression. Scores are provided for age groups ranked by life decades. Mean values and standard errors are provided for each item next to the circular plot for easier interpretation.

