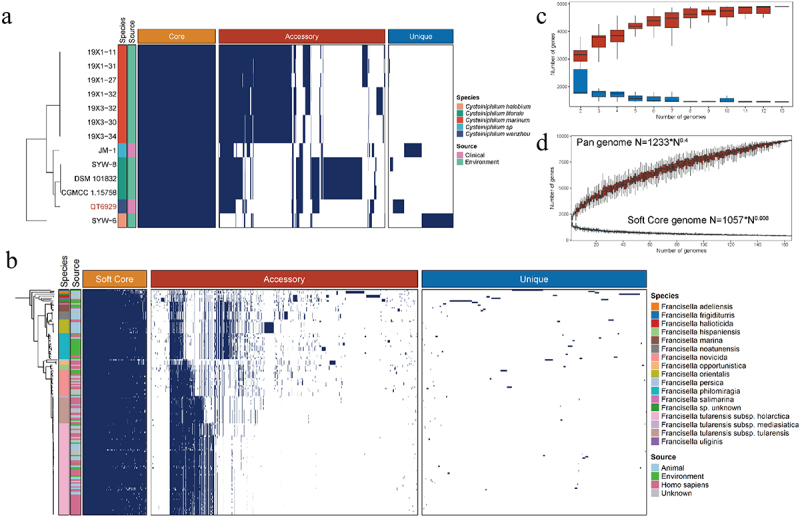
Figure 4.

Pan-genome analysis of Cysteiniphilum and Francisella genus individually. (A) Distributions of core gene (present in all genomes), accessory gene (present in 5%~95% of the genomes) and strain-specific gene (present in one genomes) in Cysteiniphilum spp. genomes. (B) Distributions of soft-core gene (present in at least 95% of genomes), accessory gene and strain-specific gene in Francisella spp. genomes. (C) Gene accumulation curve of core genes (blue) and pan genome (red) of Cysteiniphilum spp. genomes. The upper and lower edges of the boxes indicate the first quartile (25th percentile of the data) and third quartile (75th percentile), respectively, of 1,00 random different input orders of the genomes. (D) Gene accumulation curve of soft-core genes (blue) and pan genome (red) of Francisella spp. genomes.
