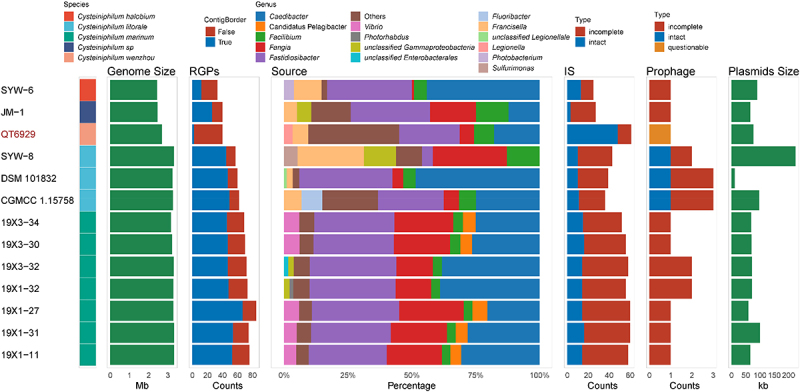
Figure 6.

Distribution of RGPs and MGEs in Cysteiniphilum genomes. From left to right represent strain species, genome size, number of RGPs, genus levels source of the closest homologs of proteins encoded on RGPs, number of IS, number of phages and total length of predicted plasmid sequences.
