. 2023 May 27;15(1):2217964. doi: 10.1080/19420862.2023.2217964

Figure 5.

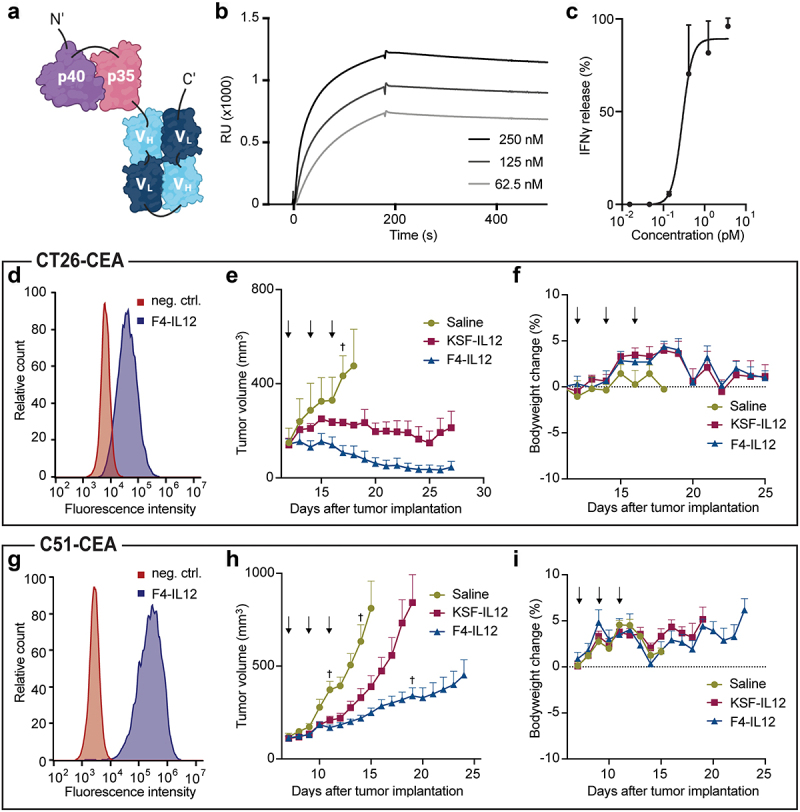
A: Cartoon showing the p40 domain linked to the p35 domain, which is linked to VH-VL-VH-VL. B: SPR line graph plotting binding over time, displaying fast association and slow dissociation. C: Line graph plotting the percentage of IFN gamma release over increasing concentration, showing an increasing sigmoidal curve. D: Flow cytometry histogram plotting relative count over fluorescence intensity on CT26-CEA cells. F4-IL12 displays increased fluorescence intensity compared to the negative control. E: Line graph plotting tumor volume over time for saline, KSF-IL12, or F4-IL12 treated mice. The curve for the saline group increases rapidly until day 18. The curve for the KSF-IL12 group initially increases and then remains stable. The curve for F4-IL12 decreases and finally remains stable. F: Line graph plotting the percentage of bodyweight change over days after tumor implantation. All groups show a constant bodyweight over time. G: Flow cytometry histogram plotting relative count over fluorescence intensity on C51-CEA cells. F4-IL12 displays increased fluorescence intensity compared to the negative control. H: Line graph plotting tumor volume over time for saline, KSF-IL12, and F4-IL12 treated mice. The curve for the saline group increases rapidly until day 15. The curve for the KSF-IL12 group increases slightly slower than for saline and stops at day 19. The curve for F4-IL12 increases slowly until day 24. I: Line graph plotting the percentage of bodyweight change over days after tumor implantation. All groups show a constant bodyweight over time.

Preclinical characterization of F4-IL12. (a) Schematic representation of F4-IL12. P35 and p40 of murine IL12 were genetically linked to F4 in single-chain diabody format. (b) Surface plasmon analysis of F4-IL12 on recombinant CEA. (c) IFNγ release assay with F4-IL12 on murine splenocytes. (D and G) Flow cytometry analysis on CEA+ CT26 (d) and C51 (g) cells. As a negative control, cells were treated with the detecting secondary antibody only. (E and H) Tumor growth of (e) CT26-CEA bearing BALB/c mice treated with 3 × 12 μg F4-IL12, KSF-IL12, or saline (n = 3) and (h) C51-CEA bearing BALB/c mice treated with the same compounds (n = 8). Mice were randomized when tumors reached an average volume of 100 mm3. Arrows indicate days of injection. †=mouse excluded due to ulceration. Bodyweight change of treated mice bearing (f) CT26-CEA tumors and (i) C51-CEA tumors. Error bars = SEM.