. 2023 May 27;15(1):2217964. doi: 10.1080/19420862.2023.2217964

Figure 6.

A: Immunofluorescence staining of the tumors of the three different treatment groups in the CT26-CEA and C51-CEA models. In CT26-CEA tumors, the saline group and the KSF-IL12 group display a green signal for the CD8 marker and a minimal green signal for the CD4 marker but no signal for NKp46 and Foxp3. The F4 IL12 group displays a green signal for the markers CD4, CD8, and NKp46 but not for Foxp3. In C51-CEA tumors, the F4-IL12 group displays a moderate green signal for the markers CD4, CD8, and NKp46 but no signal for Foxp3. The saline and KSF-IL12 groups are negative for all markers. B: Bar charts plotting the expression of different markers on tumor infiltrating T cells. IFN gamma expression in the F4-IL12 group is significantly overexpressed compared to the saline and the KSF-IL12 groups in CD4-positive T cells and compared to the saline group in the CD8-positive T cells. The expression of PD-1 in CD4-positive and CD8-positive T cells and the expression of granzyme B and perforin in CD8-positive T cells is slightly higher in the F4-IL12 group, compared to the saline and KSF-IL12 groups, although not significant.

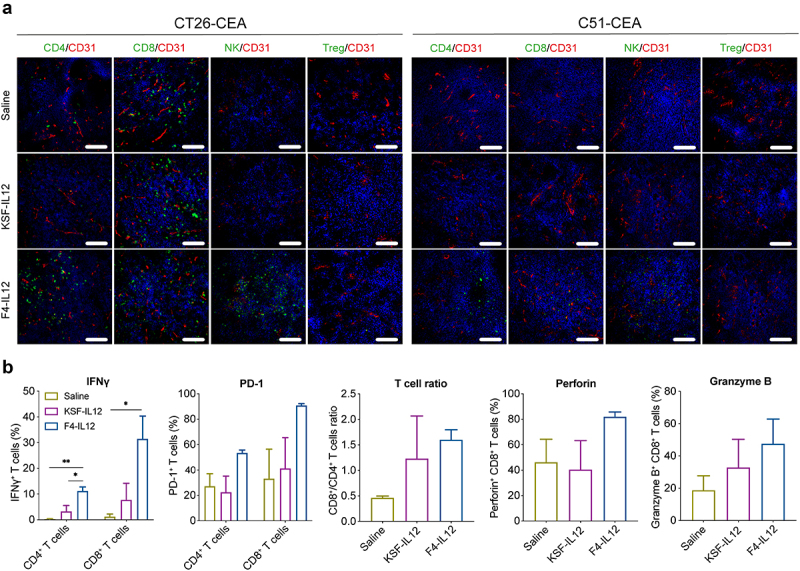
Ex vivo analysis of F4-IL12 treated tumor-bearing mice. (a) Analysis of tumor-infiltrating lymphocytes in CT26-CEA (left) and C51-CEA (right). Tumors were removed 48 hours after the third injection and analyzed by immunofluorescence staining. Markers specific for CD4+ T cells (CD4), CD8+ T cells (CD8), Natural killer cells (NKp46), and regulatory T cells (Foxp3) were used (green). Vasculature was visualized through CD31 staining (red) and nuclei with DAPI (blue). 20× magnification; scale bar = 100 μm. (b) Phenotype analysis of CD4+ and CD8+ T cells in the tumor of treated C51-CEA bearing mice. Tumors were removed 48 hours after the third injection. Bar plots show expression levels of IFNγ, PD-1 (both in CD4+ and CD8+ T cells), the ratio of CD4+ and CD8+ T cells, and expression of Perforin and Granzyme B in CD8+ T cells. Statistical differences were assessed between mice receiving saline, KSF-IL12, and F4-IL12. *p < 0.05; **p < 0.01 (regular one-way ANOVA test with Tuckey posttest). Error bars = SEM; n = 3.