Figure 2.
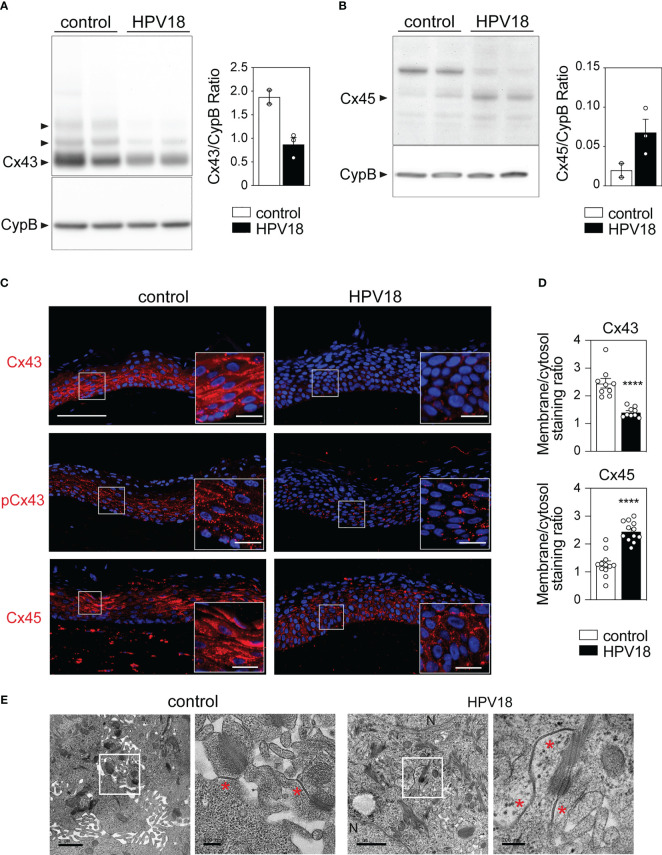
HPV-replication associated changes in Cx43 and Cx45 protein expression pattern preserves GJ plaque formation in 3D-EpCs (A, B) Representative Western blot analysis and densitometric quantification of Cx43 (A) and Cx45 (B) protein expression in epidermal sheets from control and HPV-3D-EpCs. Cyclophilin B (CypB) was used as loading control. Data in the densitometric analysis represent mean ± s.e.m. Data are representative of 2 independent experiments, including 2-3 3D-EpCs per group. (C) Representative images of control- and HPV-3D-EpCs stained for Cx43, S373-phosphorylated Cx43 (pCx43) and Cx45. Hoechst was used for nuclei staining. Insets, magnification of the selected area (white square). Scale bar=100 µm, inset scale bar=20 µm. Data are representative of 4-6 independent experiments, with n=8-16 control- and n=6-13 HPV-3D-EpCs. (D) Bar graphs representing the ratios of membrane over cytosolic staining for Cx43 and Cx45 in 3D-EpCs and HPV-3D-EpCs. Data represent mean ± s.e.m. obtained from the analysis of 3-4 fields of 3D-EpCs and HPV-3D-EpCs from 3 independent experiments. ****p < 0.001. (E) Representative electron microscopy images of control- and HPV-3D-EpC ultra-thin sections. Selected areas (white squares) are enlarged (right panels) to show gap junction plaques (red asterisks). N=Nucleus. Scale bars=1 µm and 200 nm (left and right).

