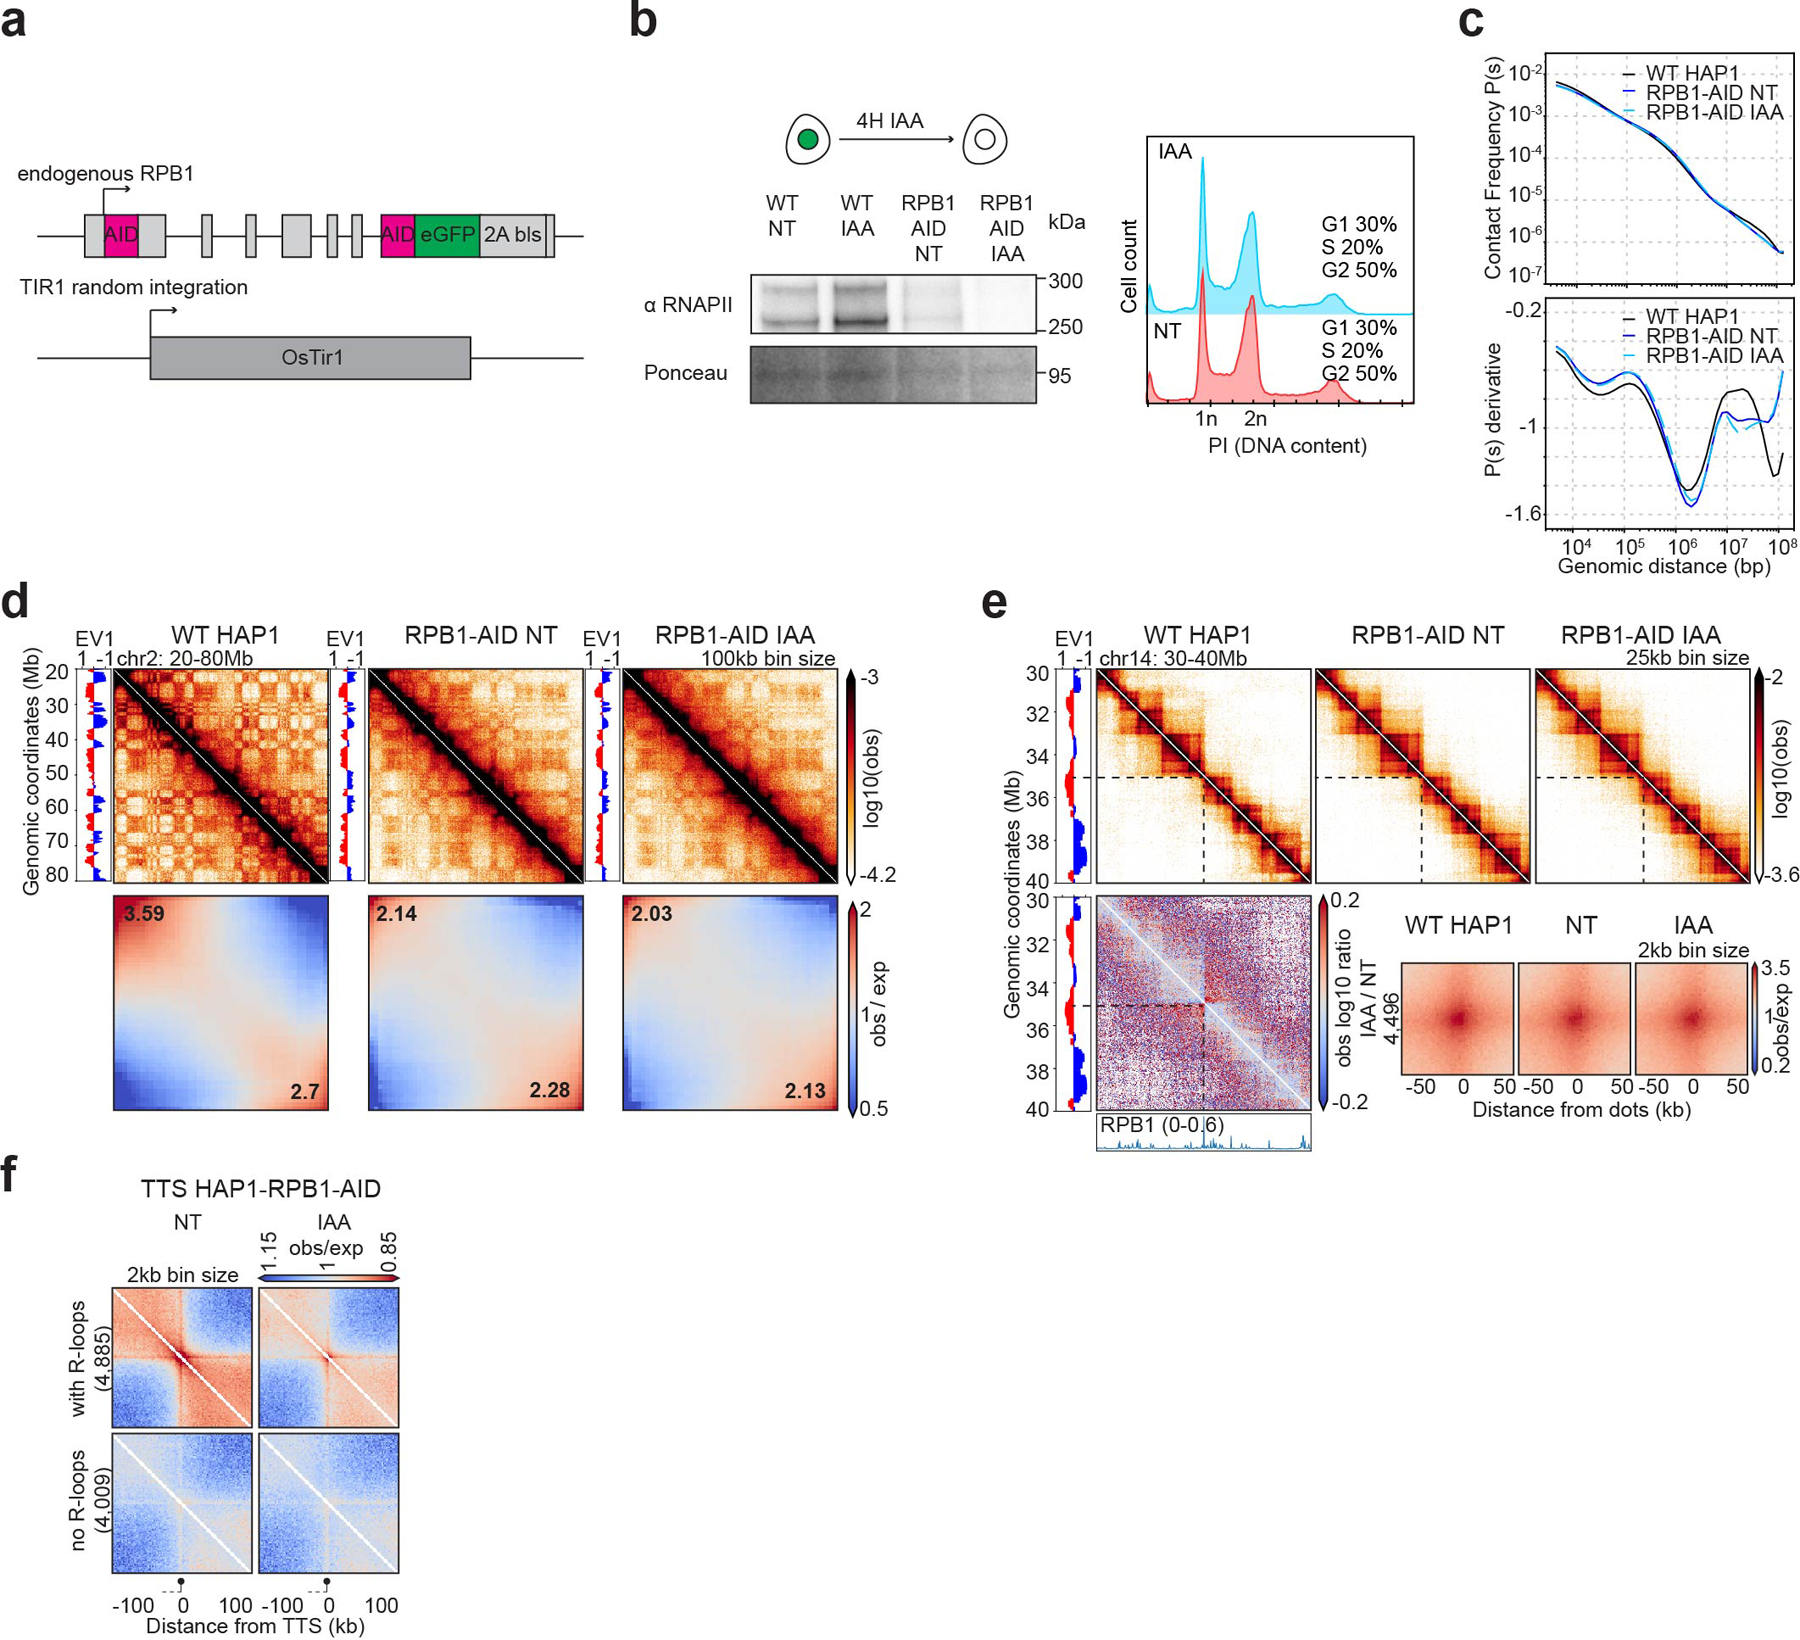
Extended Data Fig. 4. Characterization of the HAP1-RPB1-AID cell line.

a, Schematic of the HAP1-RPB1-AID construct
b, Western blot against RPB1 in WT HAP1 cells and HAP1-RPB1-AID cells showing RPB1 depletion after 4 hours of auxin treatment (IAA). Ponceau is shown for loading control. Flow cytometry for HAP1-RPB1-AID cells without/with auxin (NT and IAA) stained with Propidium Iodide (PI) to assess the DNA content for cell cycle analysis.
c, Hi-C contact frequency as a function of genomic distance, P(s) (top) and its derivative dP/ds (bottom) for HAP1 wild-type cells and HAP1-RPB1-AID cells in absence and presence of auxin.
d, Hi-C contact heatmaps at 100kb resolution with the corresponding track of the first Eigenvector (EV1) across a 60Mb region on chromosome 2 for HAP1 and HAP1-RPB1-AID cells without/with auxin. Genome-wide saddle plots of Hi-C data binned at 100kb resolution for HAP1 and HAP1-RPB1-AID cells without/with auxin. The compartment strengths are indicated in the corners.
e, Hi-C contact heatmaps at 25kb resolution with the corresponding distribution of EV1 and published RPB1 ChIP-seq signal68 for a 10Mb region on chromosome 14 for HAP1 and HAP1-RPB1-AID cells without/with auxin. The differential interaction heatmap (presence/absence of auxin) is shown on the bottom. Dot pileups for dots found in HAP1 cells that have a CTCF peak in either anchor in the CTCF degron NT sample (4,496 dots) for HAP1-RPB1-AID cells without/with auxin. The dots were aggregated at the center of a 100kb window at 2kb resolution.
f, Oriented interaction pileups for HAP1-RPB1-AID, without/with auxin, aggregated in a 200kb window at 2kb resolution were plotted for the active TTS with or without R-loops. The black circle on a stick represents the TTS and the gene body is represented by a dash line on the left of the TTS.
