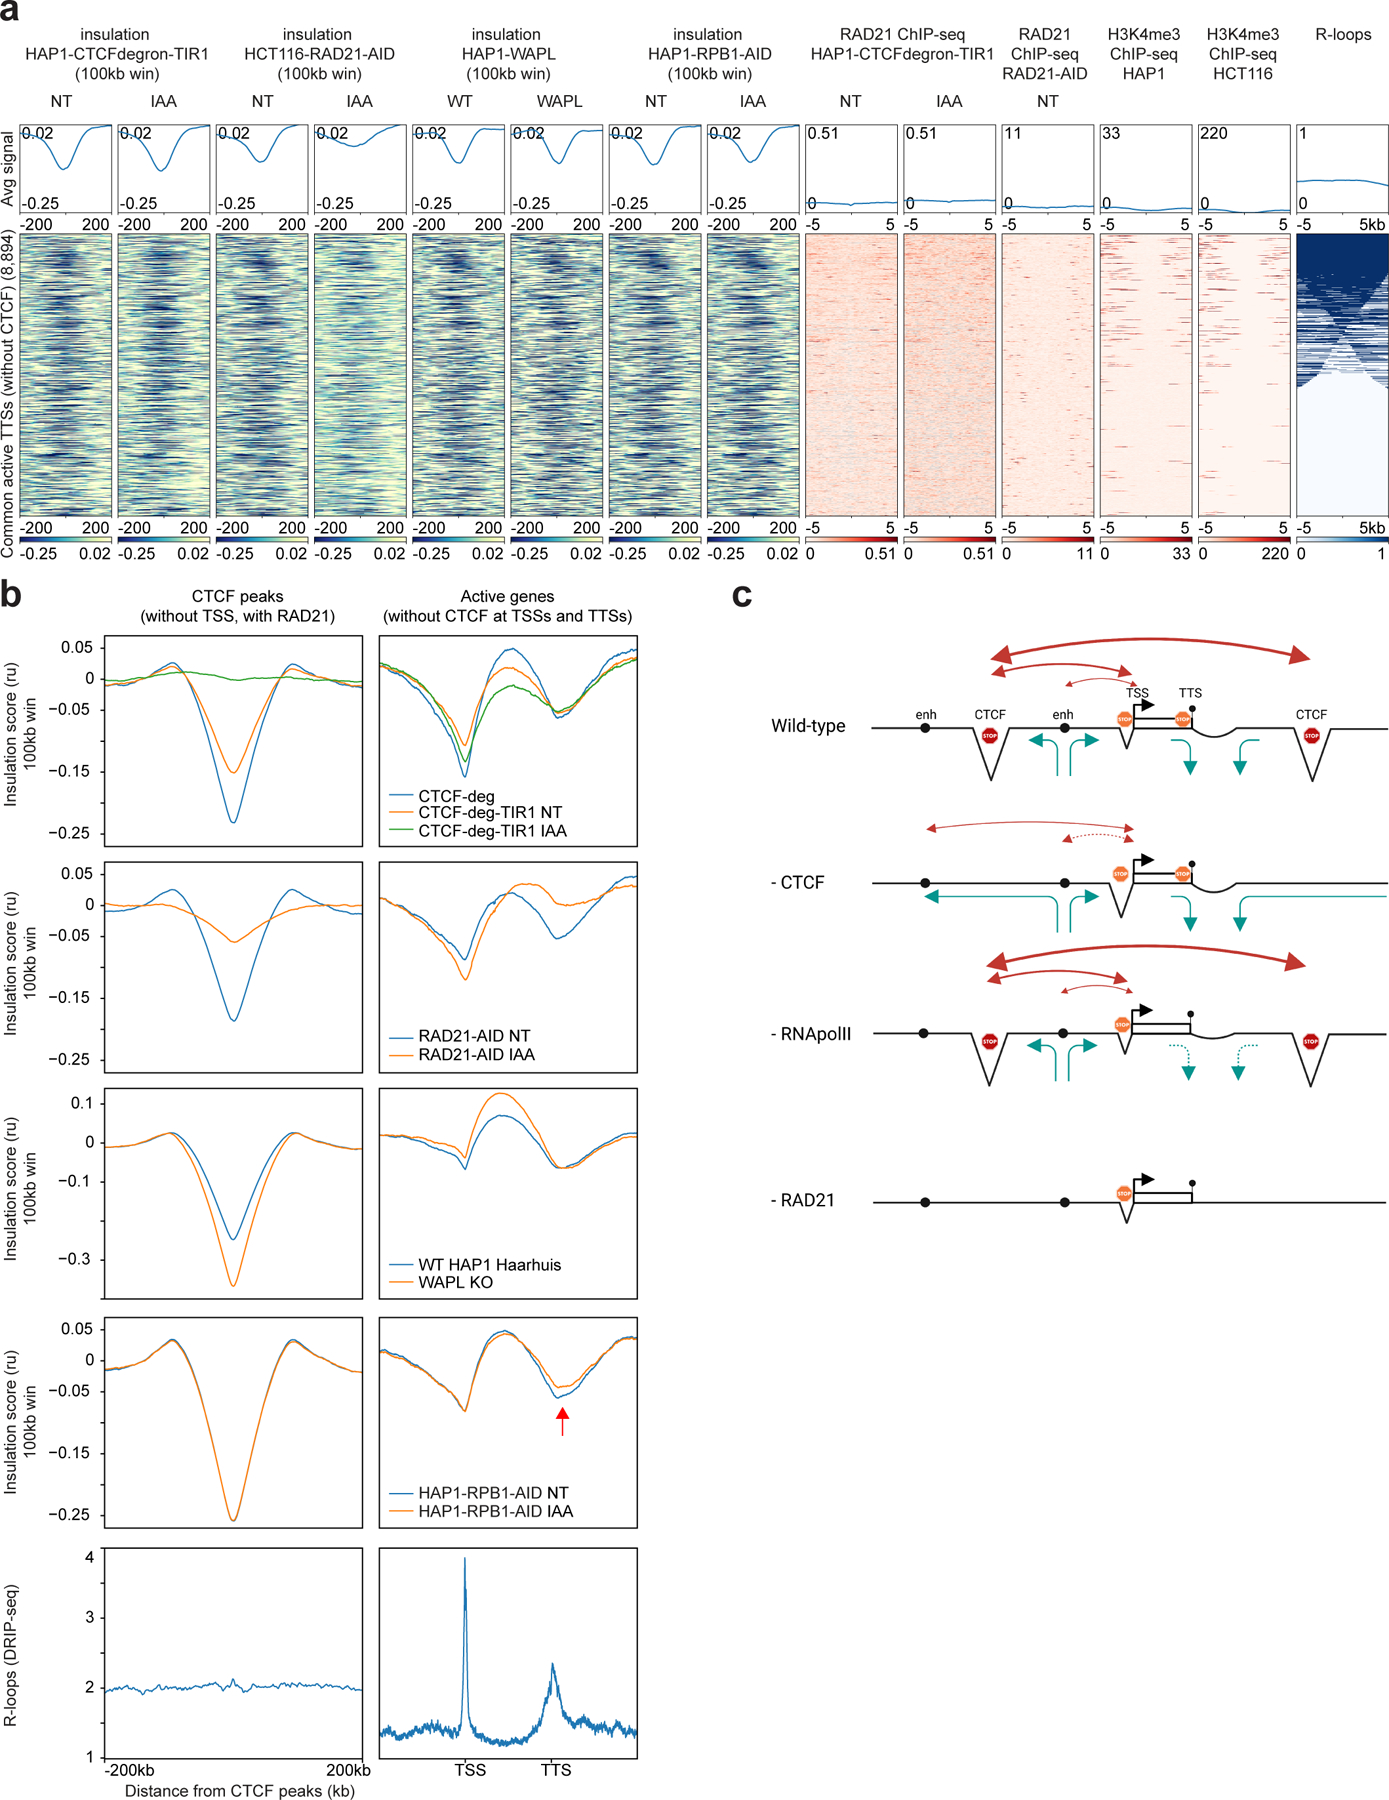
Figure 2: Active TTSs form chromatin boundaries and a cohesin traffic pattern defines promoter-enhancer interactions.

a, Stackups for active TTSs (without H3K4me3 active TSS histone mark and CTCF peaks, common between HAP1 and HCT116 cell lines) sorted on the consensus list of R-loops. Insulation in HAP1-CTCF-degron-TIR1, HCT116-RAD21-AID12 and HAP1-RPB1-AID cells without/with auxin (NT and IAA), insulation in WT HAP1 and WAPL knock-outs31 were plotted along with RAD21 ChIP-seq in the HAP1-CTCF-degron-TIR1 and HCT116-RAD21-AID12, H3K4me3 in HAP126 and HCT116 cells and the consensus list of R-loop signals. Stackups were flipped according to the orientation of the genes, to have the gene body on the left of the TTSs.
b, Average insulation profiles across CTCF peaks (without TSSs, with RAD21) (left plots) and across scaled active genes without CTCF at TSSs and TTSs (right plots) at 5kb resolution for the HAP1-CTCFdegron, HAP1-CTCFdegron-TIR1 without/with auxin (first row), for the published HCT116 RAD21-AID degron without/with auxin (second row)12, for the published WT HAP1 and WAPL knock-out (third row)31, for the HAP1-RPB1-AID without/with auxin (fourth row) and for the published R-loop DRIP-seq in K562 (fifth row)67. The red arrow represents the reduced insulation at TTSs after RNA polymerase II depletion.
c, Model for a cohesin traffic pattern. Cohesin traffic pattern (green arrows) in four cell lines (Wild-type, depleted for CTCF (- CTCF), depleted for RNA polII (- RNA polII) and depleted for RAD21 (- RAD21)) for a defined chromosomal locus. Triangles represent the three types of chromatin boundaries we identified across the locus: at CTCF sites, at active TSSs and TTSs. In this model, cohesin is loaded at enhancers (black circle), is blocked at CTCF sites, is blocked/paused at TSS (black arrow) and is blocked and unloaded at TTS (black circle on a stick). This pattern of cohesin dynamics results in promoter-enhancer interactions, CTCF sites-promoter interactions and CTCF-CTCF sites interactions (red arrows). CTCF depletion redefines the cohesin traffic resulting in re-wired promoter-enhancer interactions. RNA polII depletion mostly affects the insulation at TTSs. RAD21 depletion abolishes the cohesin trafficking and only keeps the insulation at TSSs which is mostly cohesin-independent.
