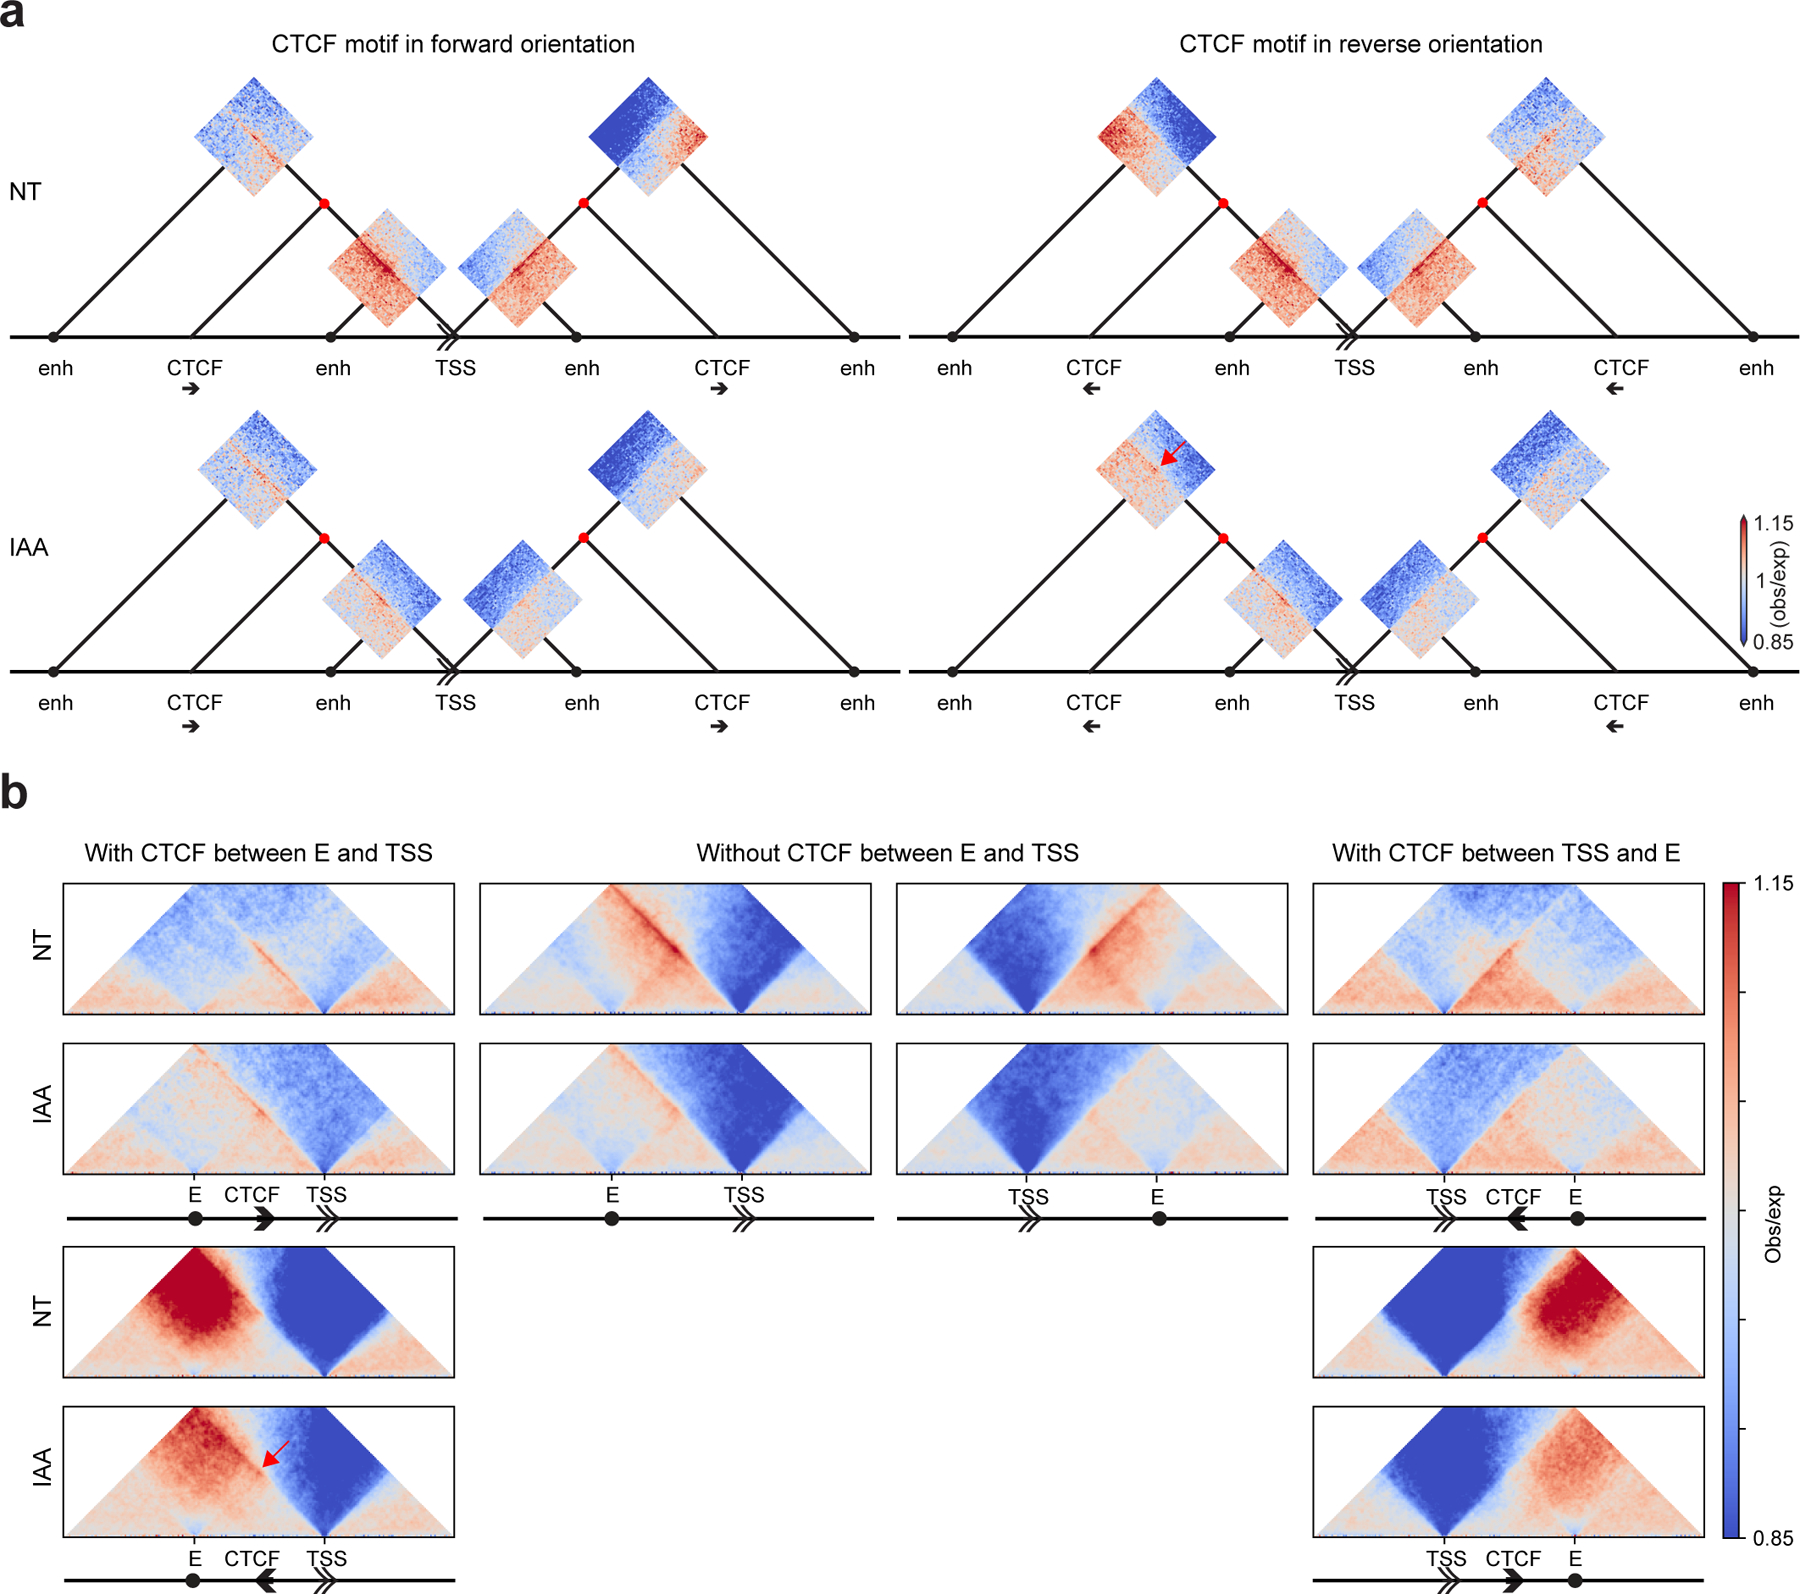
Figure 3: Rewiring of enhancer-promoter interactions after CTCF depletion.

a, Dot pileups for all pairwise combinations between active TSSs (without CTCF) and enhancers (without CTCF or TSSs) separated by 50–500kb placed on the schematic representing the different interactions. Dot pileups were separated into: upstream or downstream of the TSS and having or not having a CTCF peak with RAD21 in between the TSS and the enhancer. The promoter-enhancer interactions that had a CTCF peak with RAD21 in between them were further classified based on the orientation of the CTCF motif (four different combinations). The dots were aggregated at the center of a 100kb window at 2kb resolution.
b, Aggregated and scaled Hi-C maps for enhancer (without CTCF or TSS)-TSS/promoter (without CTCF) pairs with or without intervening CTCF peaks with RAD21 for HAP1-CTCFdegron-TIR1 cells without/with auxin (NT and IAA) at 5kb resolution.
The double arrow represents the TSS and its orientation, the black arrow represents the CTCF peak, and the black circle represents the enhancer. The red dots represent interactions between CTCF and TSS. The red arrow highlights the interaction gain after CTCF removal between enhancers and TSSs separated by CTCF sites in the reverse orientation.
