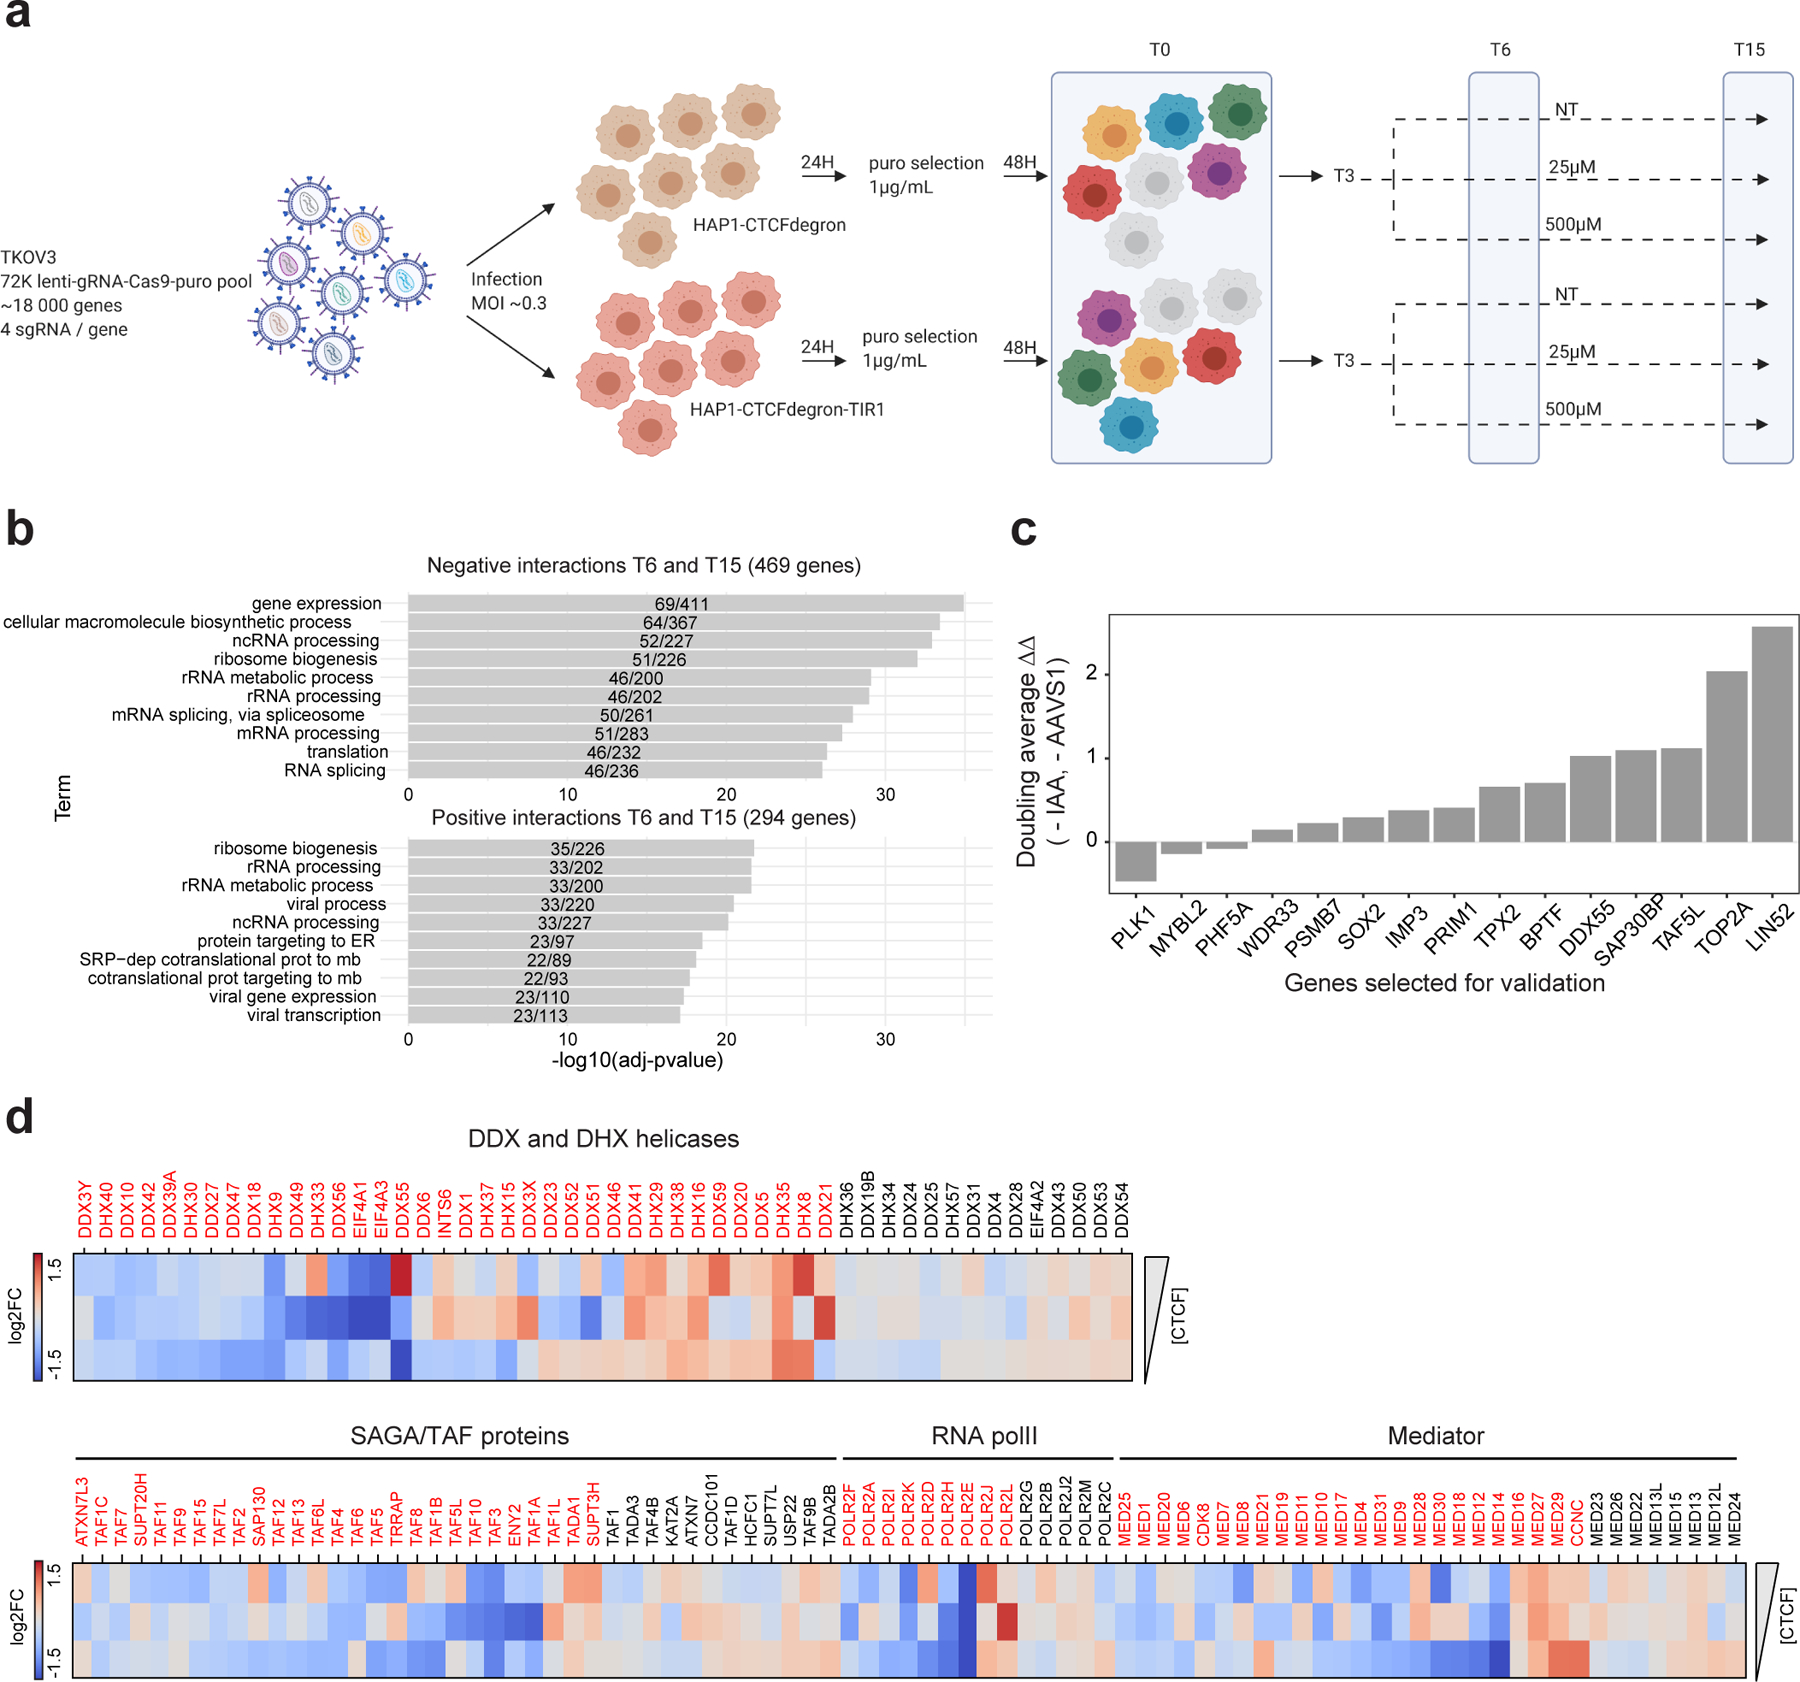
Figure 4: The cohesin traffic pattern is genetically linked to gene regulation factors.

a, Schematic of the CRISPR screen workflow for the two cell lines HAP1-CTCFdegron (brown cells) and HAP1-CTCFdegron-TIR1 (red cells) with three auxin conditions (NT, 25µM and 500µM). Colored cells represent lentivirus infections and knock-outs with different sgRNAs. On the represented timepoints (T0, T6 and T15), cells were harvested for genomic DNA extraction, PCR amplification, library preparation and next-generation sequencing.
b, Functional enrichment analysis for negative and positive interactions identified in the screen.
c, Validation for a selection of genes from the gene hits. Cells with proliferation defects when CTCF and the gene hit are depleted have positive values (ΔΔ). Cells with better proliferation when CTCF and the gene hit are depleted have negative values (ΔΔ). The auxin concentration used was 25µM.
d, Heatmaps representing the log2 fold changes normalized by the HAP1-CTCFdegron (NT, 25µM or 500µM IAA) for DEAD/H-box family helicases, SAGA/TAF proteins, RNA polII subunits and mediator subunits with decreasing amount of CTCF (HAP1-CTCFdegron-TIR1 without auxin (NT) and with auxin (25µM and 500µM IAA)). Genes indicated in red have a log2 fold change of > |0.4|.
