
Figure 6: DDX55 and TAF5L depletions alter conformation of active genes independently of CTCF.
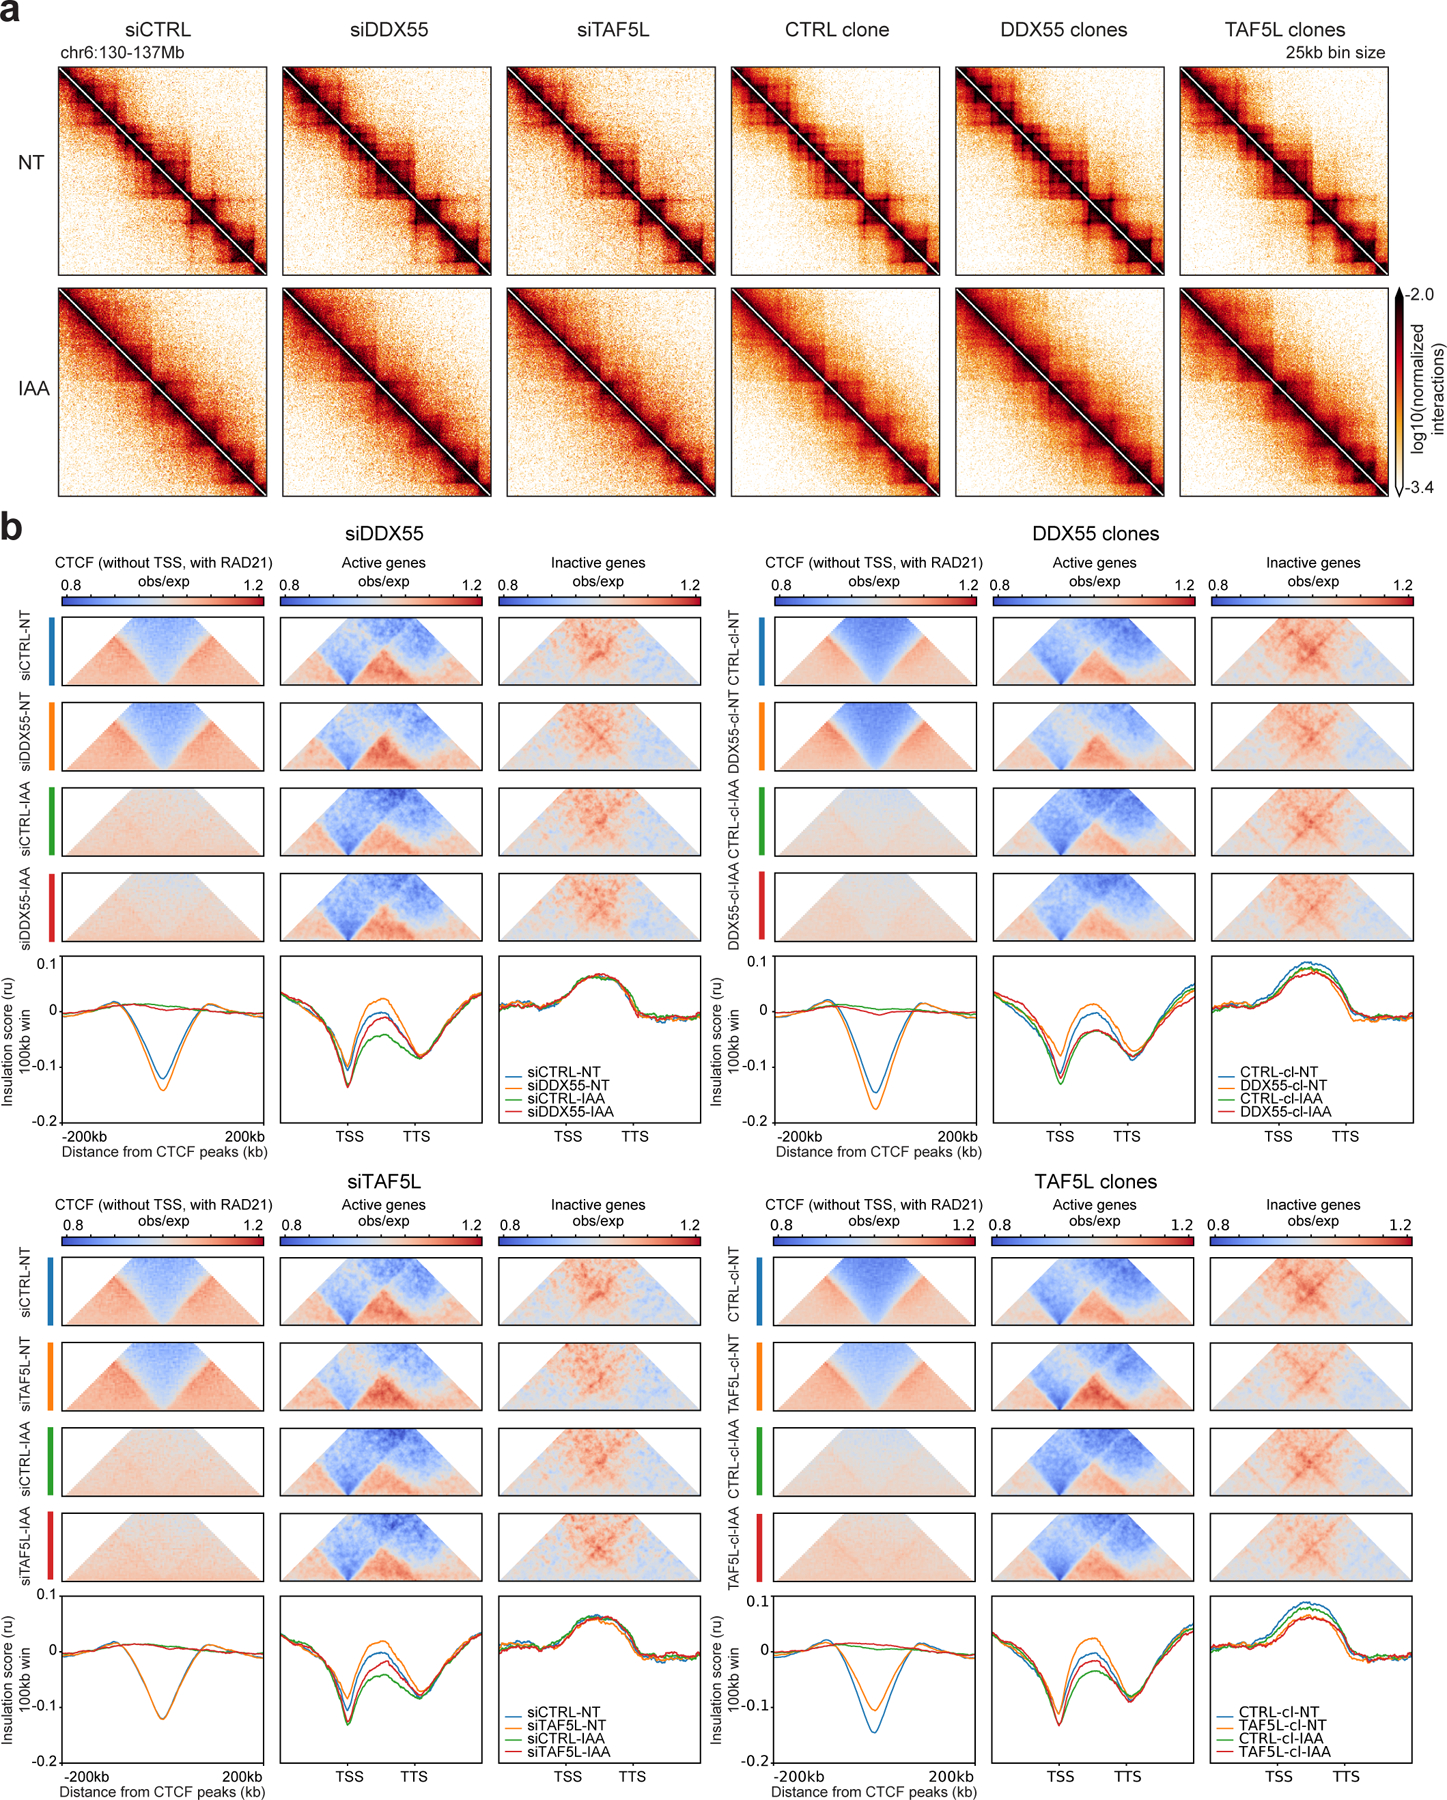
a, Hi-C contact heatmaps at 25kb resolution for a 7Mb region on chromosome 6 for HAP1-CTCFdegron-TIR1 cells depleted for DDX55 or TAF5L (siRNA and knock-out clones) without/with CTCF (NT and IAA).
b, Average insulation profiles across distal CTCF (without TSSs, with RAD21) (left plots), across scaled active genes (without CTCF at TSSs and TTSs) (middle plots) and across scaled inactive genes (without CTCF at TSSs and TTSs) (right plots) for the HAP1-CTCFdegron-TIR1 without/with auxin (NT and IAA) and with DDX55 or TAF5L depleted (siRNA and knock-out clones) at 5kb resolution. The representative scaled interaction pileups are plotted on top of the average insulation profiles.