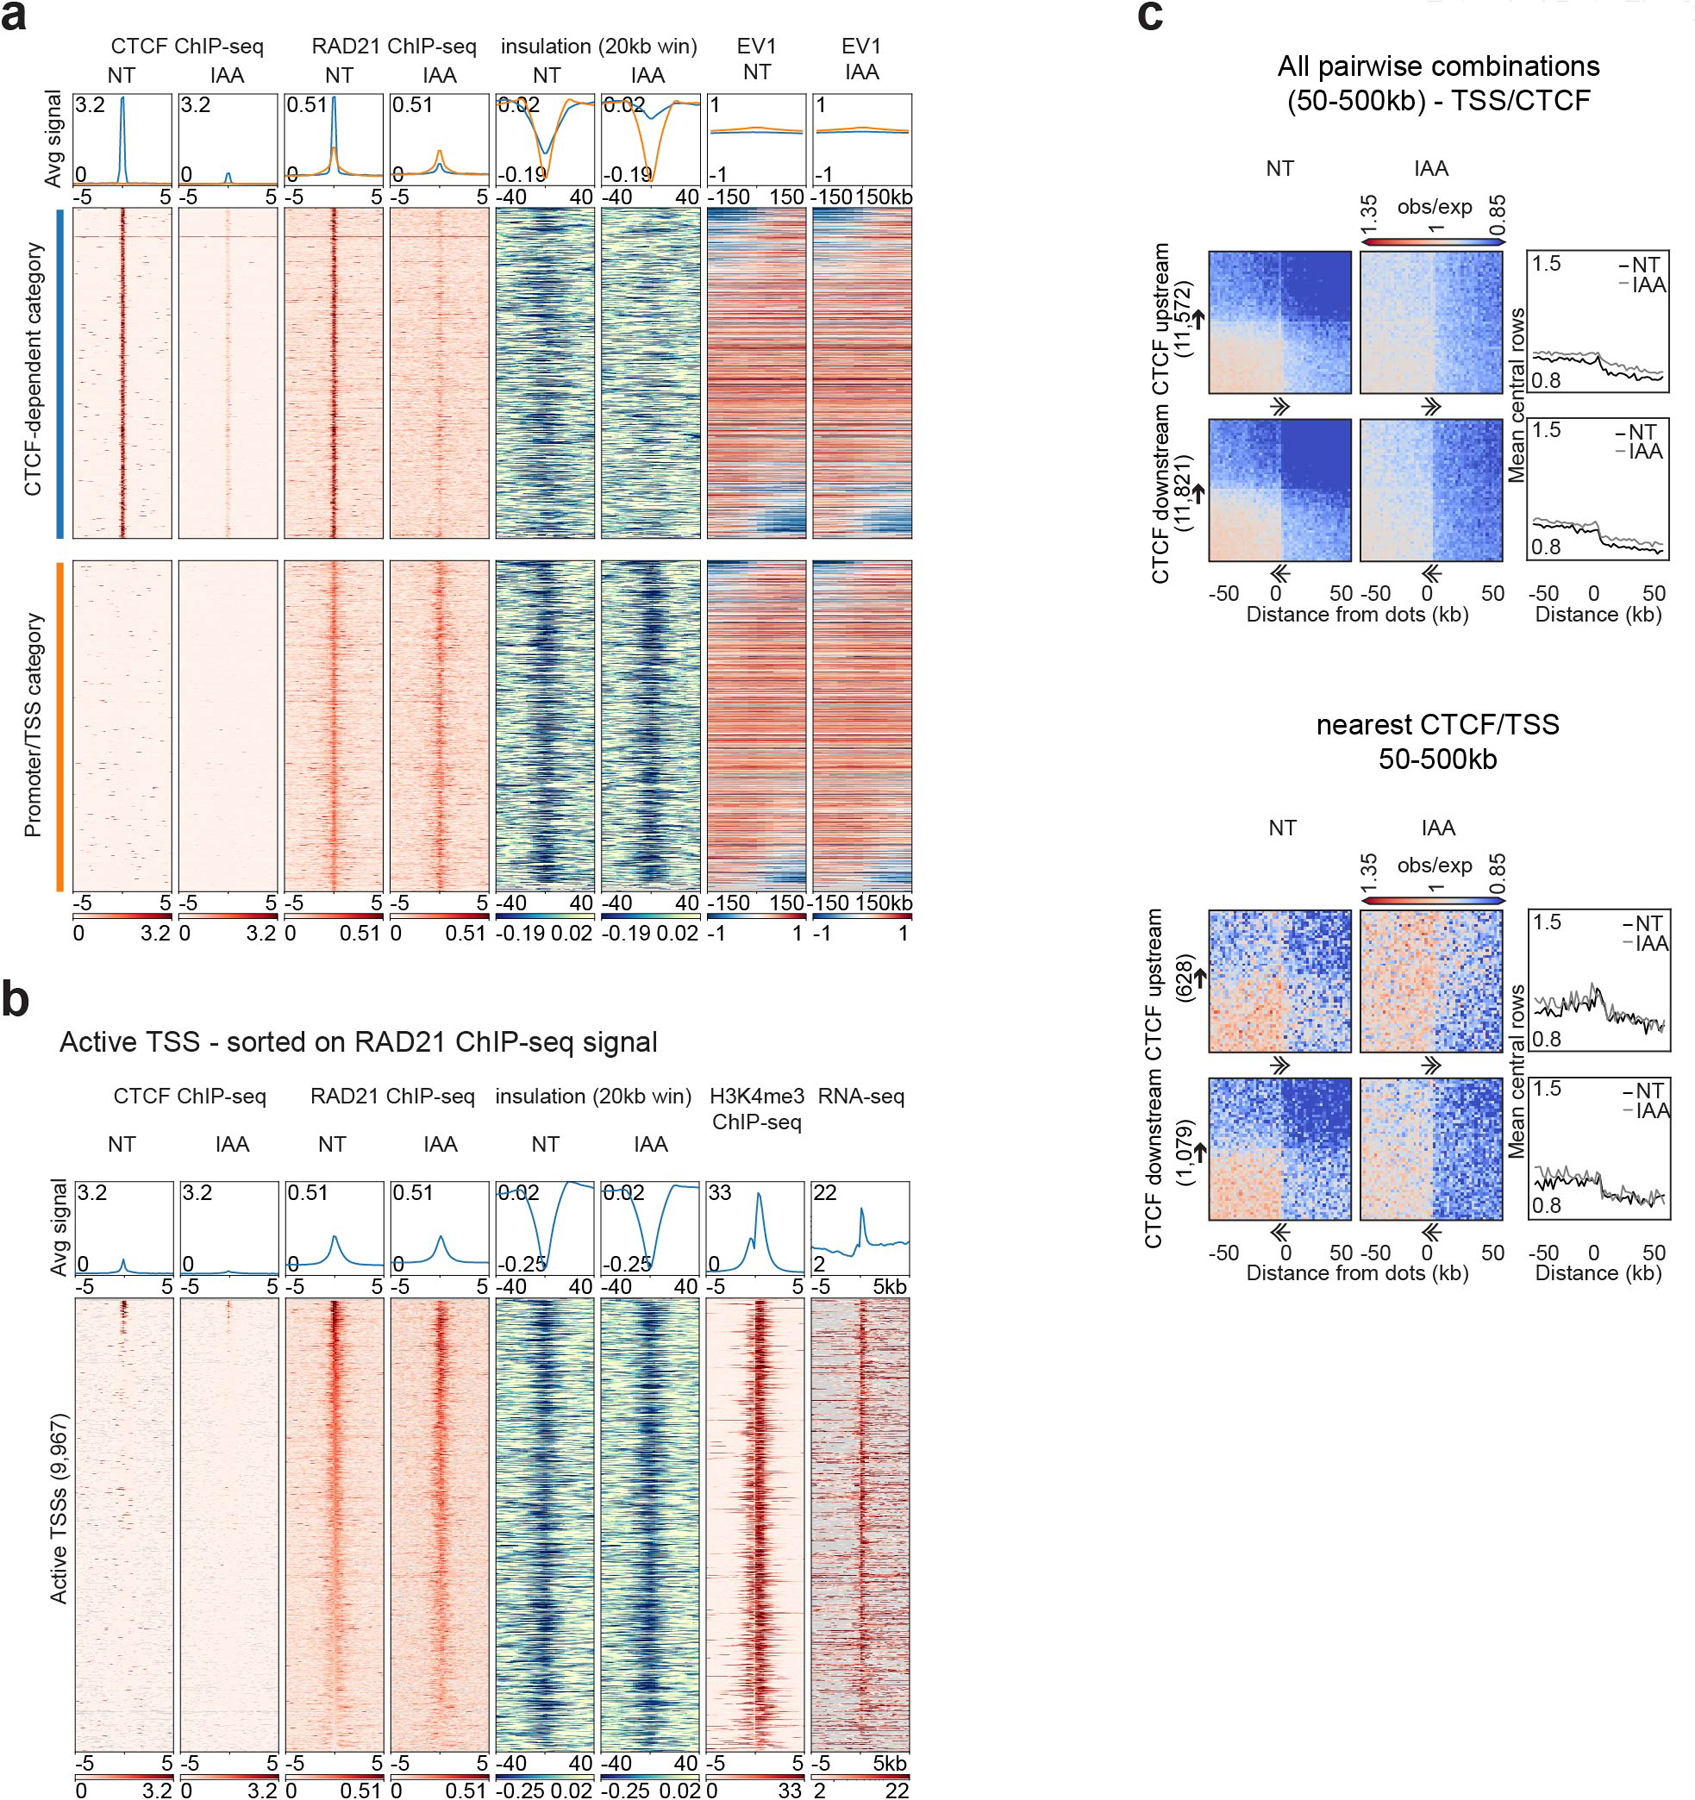
Extended Data Fig. 2. CTCF sites and active TSSs are chromatin boundaries.

a, Stackups for CTCF-dependent (blue) and promoter/TSS (orange) categories sorted on the change of the first Eigenvector (EV1, 25kb) from left to right flank. CTCF and RAD21 ChIP-seq, calculated insulation and EV1 in HAP1-CTCFdegron-TIR1 cells without/with auxin (NT and IAA) were plotted.
b, Stackups for active TSSs, sorted on RAD21 ChIP-seq signal. CTCF and RAD21 ChIP-seq, calculated insulation and RNAseq in the HAP1-CTCFdegron-TIR1 cells without/with auxin were plotted along with the published HAP1 H3K4me3 ChIP-seq26. Stackups were flipped according to the orientation of the genes, to have the gene body at the right of the TSSs.
c, Dot pileup aggregation plots for remaining CTCF motif orientations represented in Fig. 1e for a 100kb window at 2kb resolution. With orientation (top). CTCF (upstream or downstream)-TSS pairwise interactions are plotted with their quantifications (mean of the 5 central bins at the CTCF site). Nearest analysis (bottom). CTCF (upstream or dowstream)-TSS pairwise interactions are plotted without any CTCF peaks or TSSs in between them with their quantifications (mean of the 5 central bins at the CTCF site). The black arrows represent the CTCF motif and the direction of the arrow, the motif orientation. The double arrows represent the TSSs and the direction of the arrow, the TSSs orientation.
