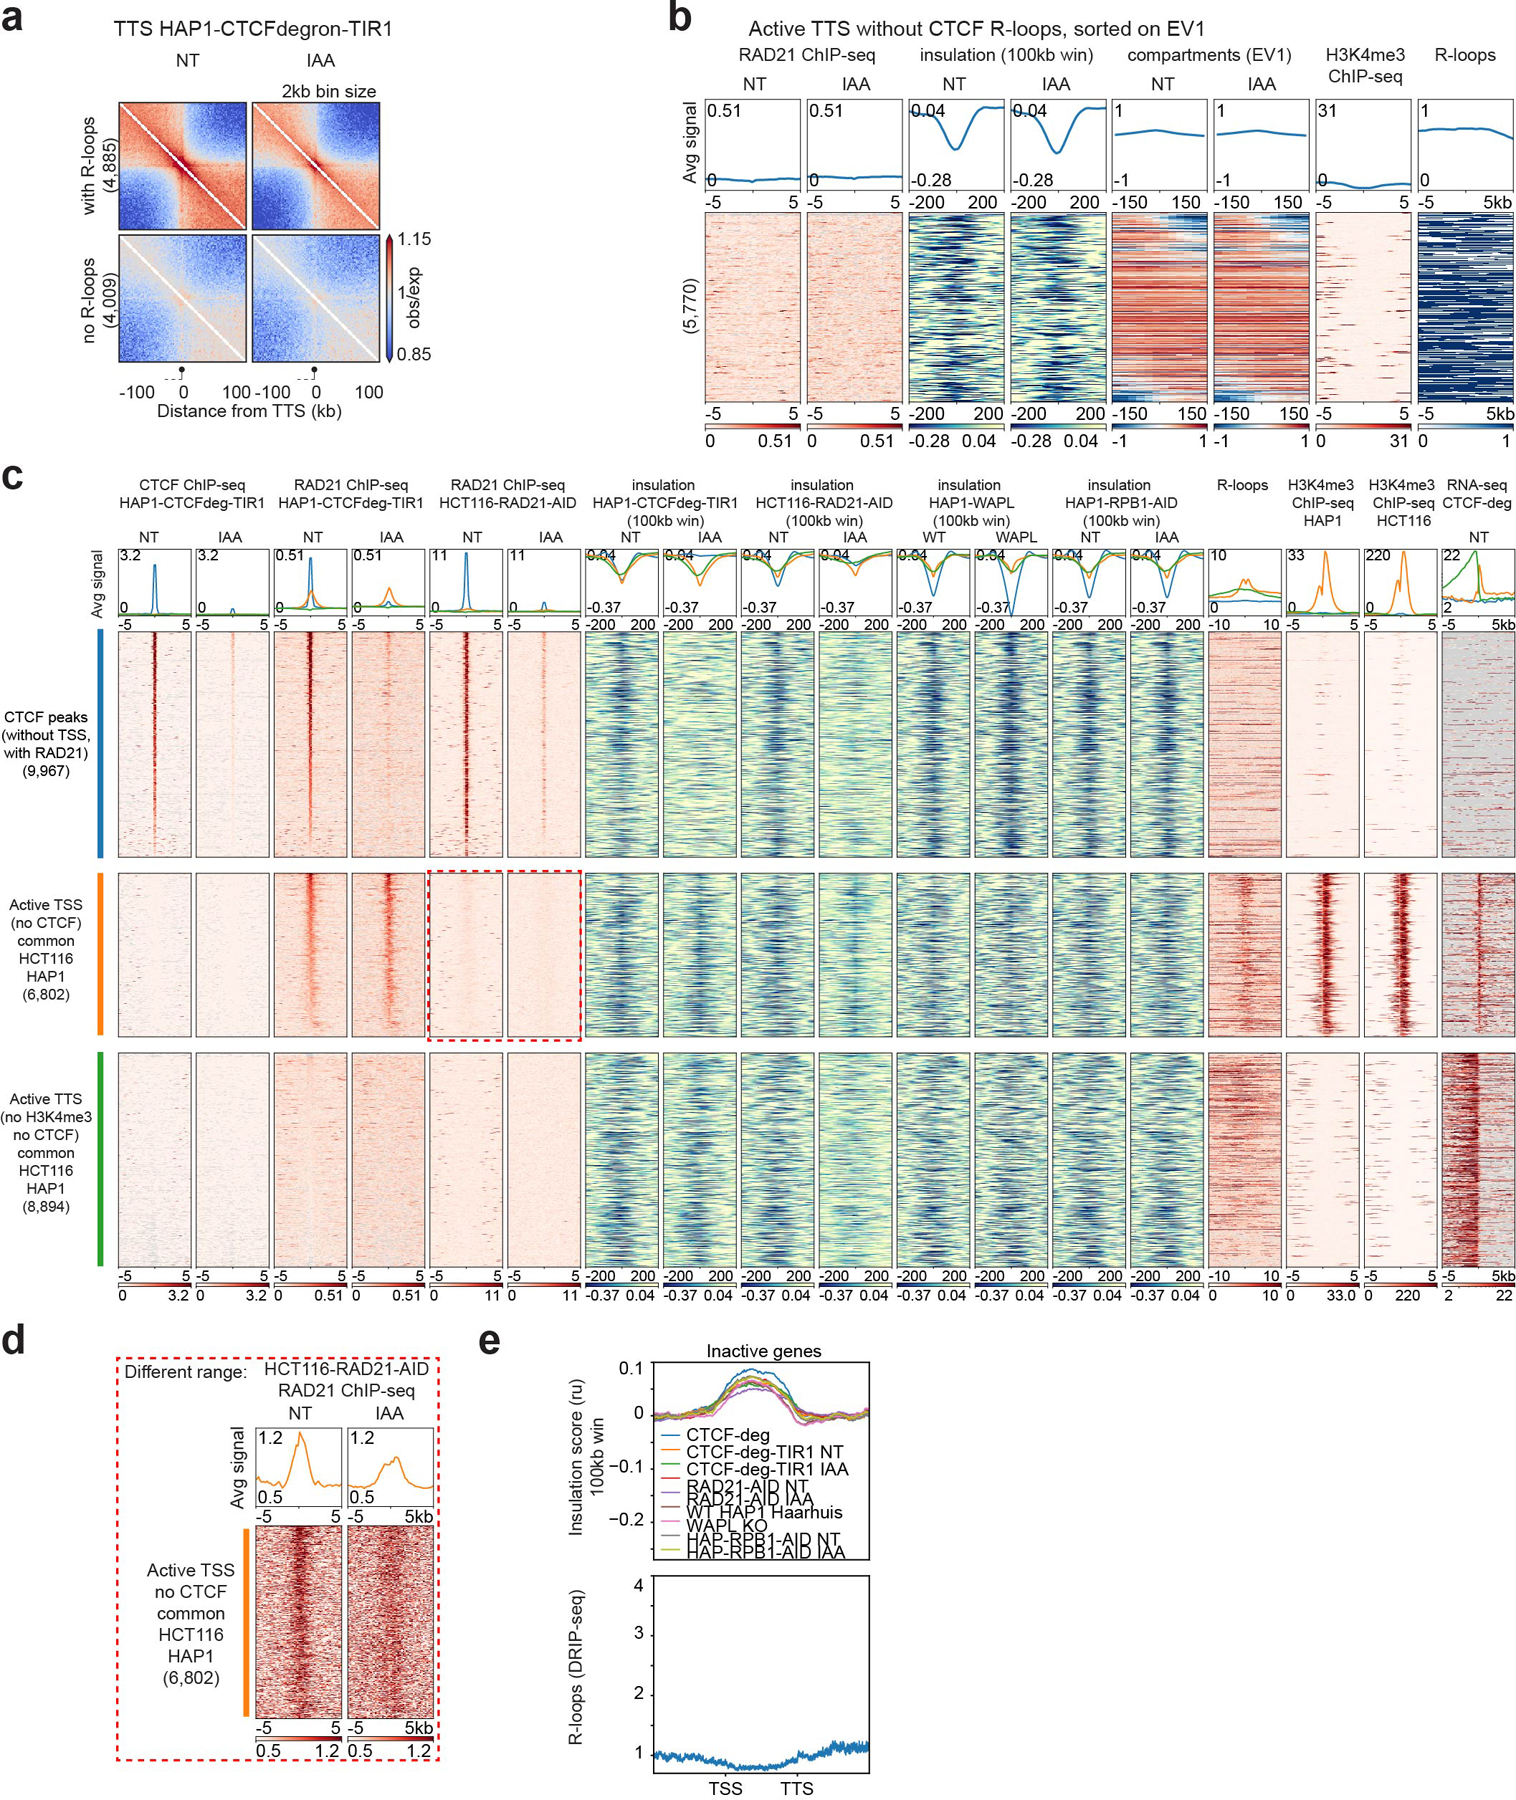
Extended Data Fig. 3. CTCF, RAD21, WAPL and RNA polII depletion effects on the three types of chromatin boundaries.

a, Oriented interaction pileups for HAP1-CTCFdegron-TIR1, without/with auxin (NT and IAA), aggregated in a 200kb window at 2kb resolution were plotted for the active TTS (without CTCF) with or without R-loops. The black circle on a stick represents the TTS and the gene body is represented by a dash line.
b, Stackups for active TTS (without CTCF, with R-loops), sorted on the change of first Eigenvector (EV1, 25kb) signal from left to right flank. RAD21 ChIP-seq, calculated insulation and EV1 in HAP1-CTCFdegron-TIR1 cells without/with auxin were plotted along with the published HAP1 H3K4me3 ChIP-seq26 and the consensus list of R-loops.
c, Stackups for the three categories of insulation: the CTCF peaks (without TSSs, with RAD21) (blue), the active TSSs (orange) and TTSs (green) common between HAP1 and HCT116 cell lines, sorted on the NT RAD21 ChIP-seq signal. The CTCF and RAD21 ChIP-seq signals, the RNA-seq and the insulation for the described cell line and condition were plotted along with the published K562 R-loops67 and the HAP126 and HCT116 H3K4me3 ChIP-seq signals. Stackups were flipped according to the orientation of the genes, to have the gene body on the right for the TSSs and on the left of the TTSs. The red dashed rectangle indicates the zoom in Extended Data Fig. 3d.
d, Active TSSs common between HAP1 and HCT116 cell lines (without CTCF) were plotted with a different scale to show the remaining RAD21 after RAD21 depletion (red dashed rectangle).
e, Average insulation profiles across scaled inactive genes without CTCF at TSSs and TTSs at 5kb resolution for all the Hi-C libraries plotted in Fig. 2b.
